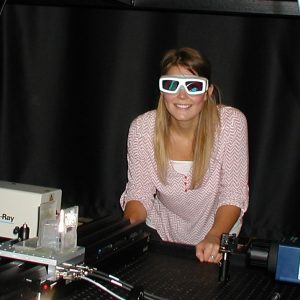
At last week’s annual meeting of the Geological Society of New Zealand, the PALs (and our friends from the PORO lab) had quite the showing! Icing on beautiful presentations by all were two prizes for runner-up student presentations. James Clarke presented his work on laboratory analogues of volcano-seismic signals, and Jonathan Simpson reported on the setup he built for laser ultrasound under pressure to explore anisotropy and fracturing in Alpine Fault Rocks. To top the awards off, Shreya Jagdish Kanakiya won the Jim Ansell award, “awarded by the Committee of the Geoscience Society of New Zealand (Inc.) to the applicant whose subsequent career, in the opinion of the Committee, is the most likely to advance geophysics in New Zealand.” No pressure, Shreya!
Category: PALNews (page 3 of 9)
Kia ora! I am a final-year PhD student in the Physical Acoustics Laboratory at the University of Auckland, under the supervision of Jami Shepherd, Guillaume Renaud (TU Delft) and Kasper van Wijk. My provisional thesis title is “Using Light and Ultrasound for Quantification of Hemodynamics in Bone“. My research develops and utilises Photoacoustics and Ultrasound vector-flow techniques to determine blood flow from these images. With refraction-corrected imaging, my project aims to accurately determine blood flow in bone. Currently, we test our techniques in bench-top phantoms but we hope to move towards in vivo imaging soon!
Selected works:
- Publication in Photoacoustics (2024): Vector-flow imaging of slowly moving ex vivo blood with photoacoustics and pulse-echo ultrasound
- PhD Provisional year report (2022): Using Light and Ultrasound for Quantification of Hemodynamics in Bone
- BSc Honours Thesis (2021): Photoacoustic Velocimetry
- Summer Research Report (2019): Photoacoustic Imaging & Flow Observation
- Summer Research Report (2018): Monitoring the Auckland Volcanic Field using Ambient Seismic Noise
After a postdoctoral fellowship at Sorbonne Université, Laboratoire d’Imagerie Biomédicale in Paris, France, Jami has returned as a DWC postdoctoral fellow in the Physical Acoustics Lab. We thank the Dodd Walls Centre for their support and are thrilled that she’s back to lead our research in medical imaging. On a personal note: Jami is from here on called “Jami Johnson Shepherd”, which means we also congratulate her and her new husband Sam!
Barring some minor thesis corrections, Sam Hitchman has now fulfilled all the requirements towards his PhD degree! Today’s oral defence of his work was highly impressive to witness. We are all very proud of Sam and congratulate him on a thesis full of exciting developments in laser ultrasound. Sam has built laser detectors for ultrasound, and successfully used them in some very exciting applications in deciphering the physical properties of rocks, fruit, and timber. Well done, Sam!
At this year’s annual meeting of the Dodd Walls Centre, Jonathan Simpson won a prize for his presentation on the first laser ultrasonic measurements on rocks under high pressure. For his MSc research, Jonathan has built an arduino-driven servo system to rotate rocks inside our pressure vessel with optical windows. We congratulate Jonathan (again!) for the success of his hard work!
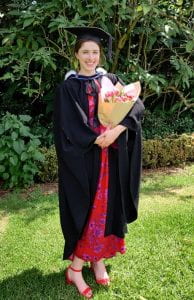
Last week, was graduation at the University of Auckland. Two PALS received degrees from the faculty of science: Jonathan Simpson received a BSc (honours) in Geophysics, and Rabea Pleiss graduated as a Science Scholar with a BSc in Geophysics, as well. We are very proud of them, and are pleased that both will be with us a bit longer for MSc degrees. In Rabea’s case, this won’t be for a few months, as she’s off to Central America first!
- Jonathan Simpson graduating with a BSc(hons) degree in Geophysics, 2018.
- Rabea Pleiss graduating from the Science Scholars programme, 2018.
The Auckland Volcanic Field (AVF) contains surface expressions of more than 50 volcanic eruptions (red in the figure below). The last eruption, Rangitoto Island, was only 600 years ago! Why the AVF is here, remains a question to this day. The field is not on a plate boundary, but also not a intraplate volcanic field such as the hotspots of Yellowstone and Hawaii. GeoNet has instrumented the area with a network of seismometers (black circles). 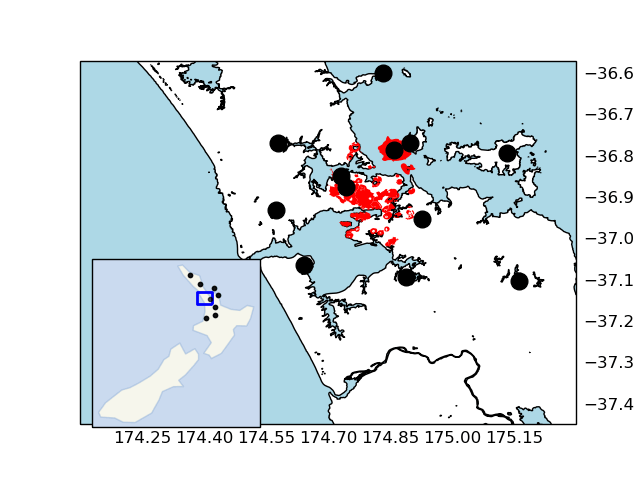 Seismologists monitor the AVF with this network, while the DEVORA project studies the geologic hazard and risk associated with the AVF.
Seismic activity in the area is actually relatively low, but recent advances in seismology allow us to study the subsurface using seismic surface- and body waves.
Surface Waves
Noise of the city and the surrounding oceans generate seismic surface wave energy. We extract information between seismic stations as if one of the seismic stations were the source (the “earthquake”) and the other the recorder. To do this properly for all stations in the AVF, we first need to determine the orientation of each seismic station.
Body Waves
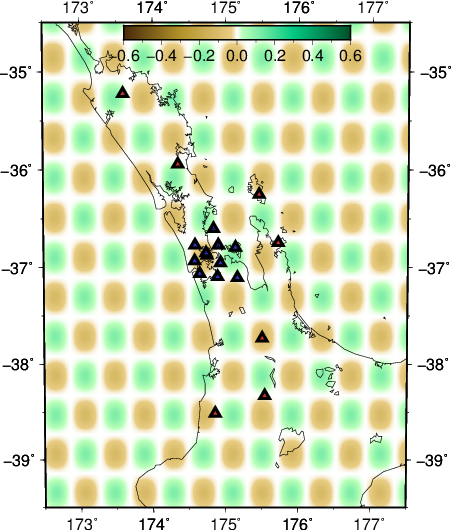
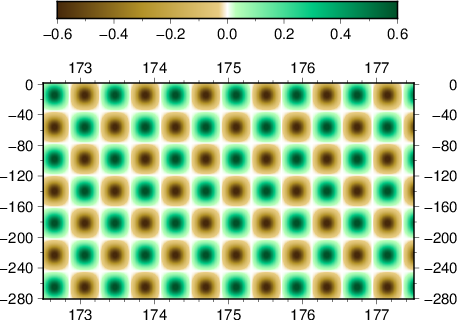
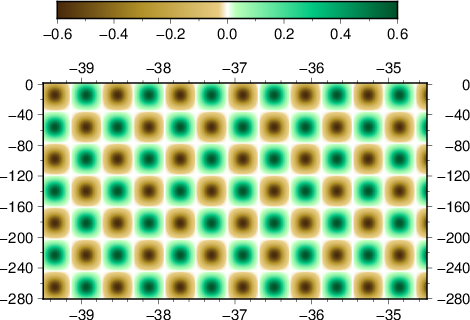
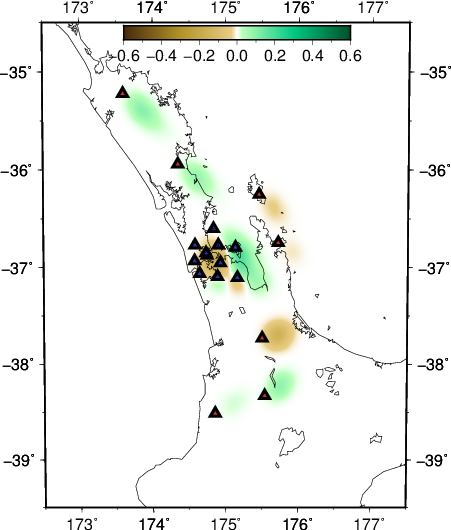
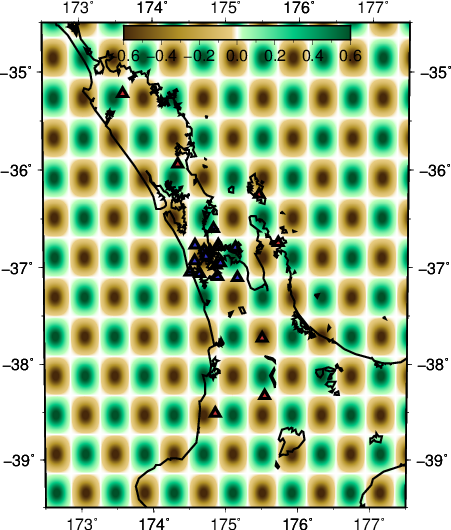
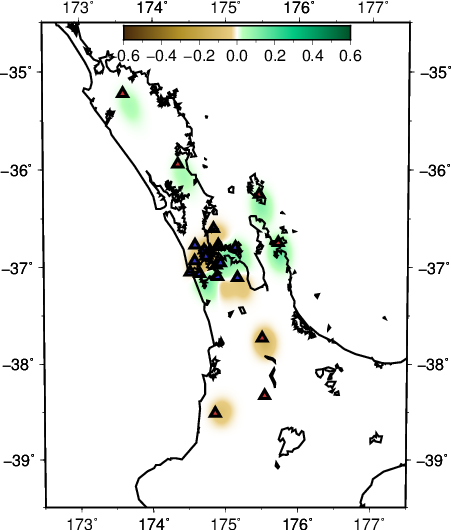
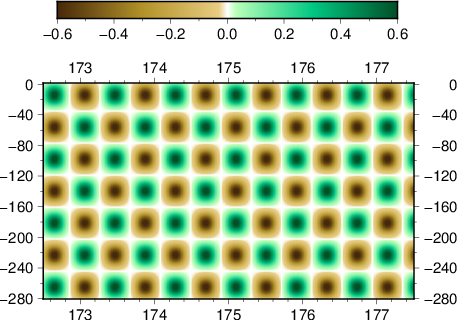
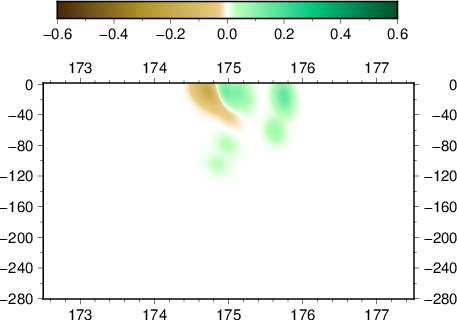
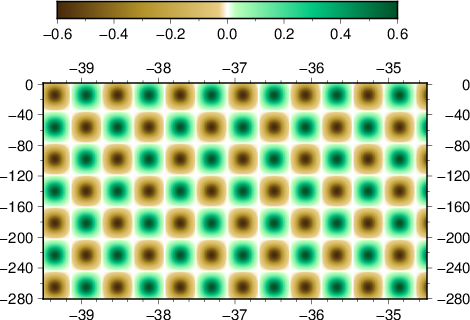
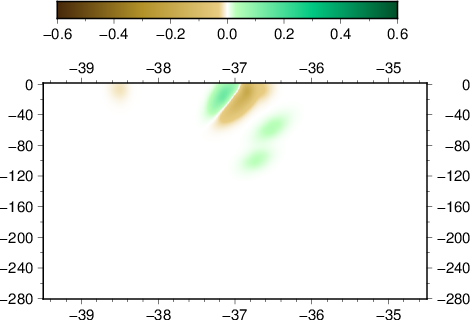
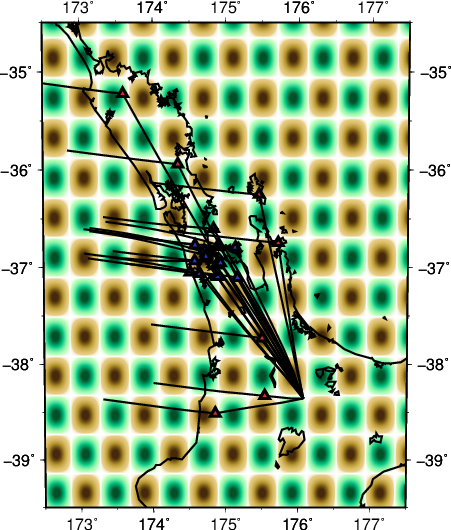
Earthquakes from regional and teleseismic events provide P- and S-waves for body tomography. A synthetic checker-board test helped us determine the expected resolution, after which we embarked on a preliminary tomographic inversion using data from 100+ teleseismic (far away) events.
Our results in regards to the checker-board tests show convincing observations. However there are still work to be done in terms of the data fitting. The joint inversion misfits do not reflect the good misfit of local and teleseismic event inversion individually.
One sample
In order to see the behaviour of the joint inversion, we start with the simplest case of jointly invert one local and one teleseismic event.
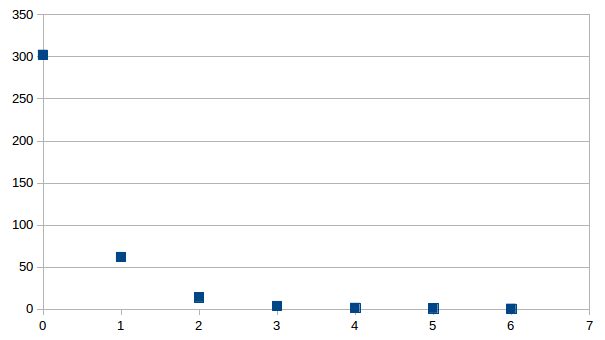
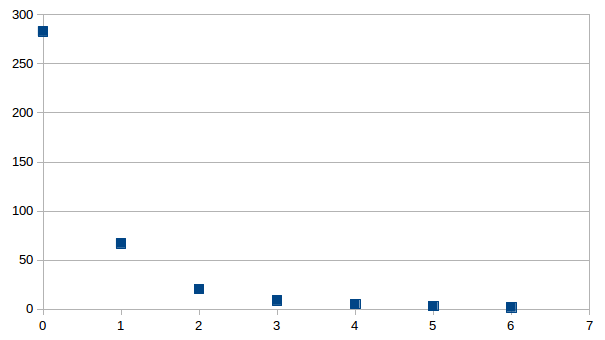
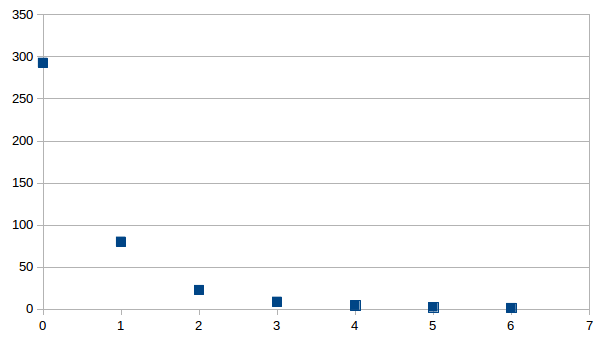
Individually inverting each event shows that the misfit can be minimized. For a single source this is theoretically expected. For the local source inversion, after six iterations, the rms misfit reaches 0.46 ms. Whereas for teleseismic source, after six iterations, the rms misfit reaches 1.84 ms.
- RMS residual in milisecond versus iteration for local (top) and teleseismic (bottom) inversion using one sample each
The corresponding models are as follow:
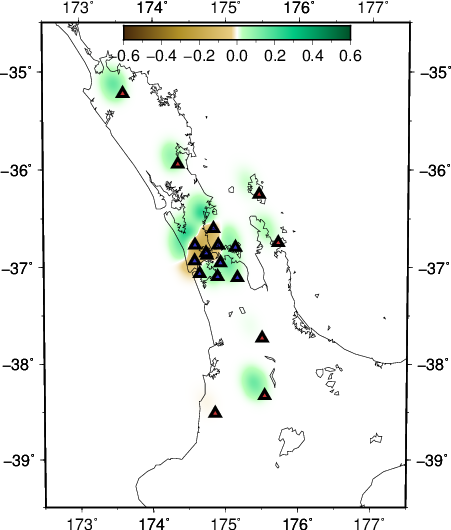
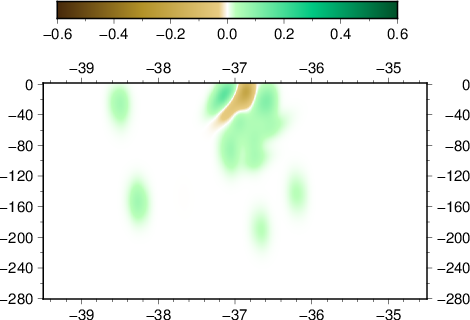
- depth slice at 30 km
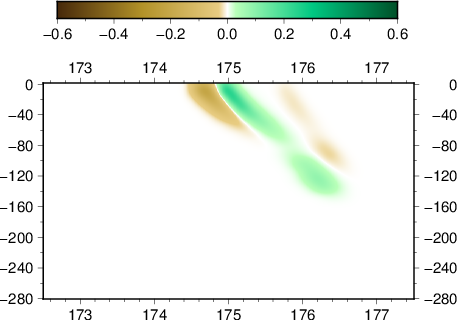
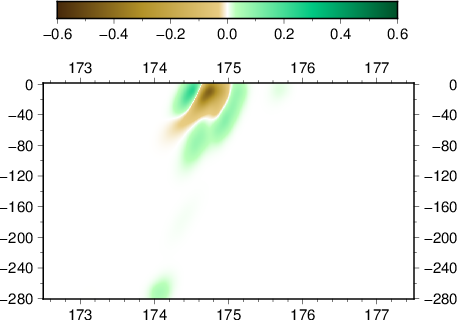
- EW slice at 36.85 S
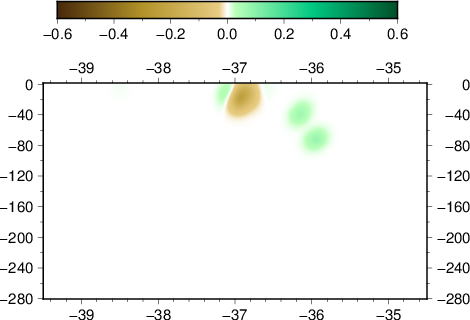
- NS slice at 174.75 E
Where the first three are the initial model, the middle three are for the local event inversion, and the bottom three are for the teleseismic event inversion.
Next is to see the trend in misfit when the two events are inverted jointly. Since the events are coming from different directions, there should not be any conflicting information with regards to raypaths, so we expect the misfit to be similarly small.
Results shows that this is indeed the case, where the rms misfit after six iterations reaches 1.37 ms. This observation does not indicate a deterioration in data fit while performing a joint inversion of a single local and teleseismic source.
The recovered model is also improved accordingly.
- depth slice at 30 km
- EW slice at 36.85 S
- NS slice at 174.75 E
Adding events
Adding one more local source to be inverted does not reduce the misfit significantly. After six iterations, rms misfit reaches 1.52 ms. On the other hand, adding another teleseismic event on top of that doubles the misfit to 3.22 ms, albeit this value is still very small.
We keep adding more events. Additional local source (5 in total) produce a misfit of 3.02 ms, slightly less than 4 sources inversion. If on top of that we invert an extra teleseismic source (6 in total), the rms value goes to 4.25 ms. So far, it seems that the highest influence in terms of increasing the misfit has been in relation to the addition of teleseismic source.
Misfit trend
We would like to show the progression of the misfit of the data with the addition of events for local sources only. We show here the rms residual in millisecond after six iterations using varying number of local sources starting from 1 event increasing to 2, 5, 10, 50, and 100 events. Consistently in all cases we turn the regularization off by making eta and epsilon equal to zero.
(table) 6 iterations rms values for varying number of sources
| 1 | 2 | 5 | 10 | 50 | 100 | |
| 0 | 302.25 | 232.17 | 245.38 | 231.66 | 250.63 | 261.3 |
| 1 | 61.99 | 42.75 | 45.35 | 58.04 | 64.75 | 75.62 |
| 2 | 13.85 | 10.25 | 12.42 | 18.14 | 25.81 | 32.31 |
| 3 | 3.76 | 3.38 | 5.5 | 8.79 | 14.77 | 19.17 |
| 4 | 1.49 | 1.8 | 3.28 | 5.96 | 10.98 | 13.91 |
| 5 | 0.8 | 0.77 | 2.25 | 4.39 | 9.61 | 11.42 |
| 6 | 0.46 | 0.61 | 1.58 | 3.29 | 8.46 | 9.78 |
Visually, we see that apart from the one source inversion, from 2 sources to 100 sources the lines corresponded to the rms residual improvement are shifted upward with the addition of more sources. This seems to imply that progressively the misfit shy away from zero with the inclusion of extra sources in the inversion.
One of the mystery in our synthetic tomography test is the data misfit shown by the joint inversion of local and teleseismic sources. In summary, inversion of local and teleseismic earthquakes individually shows a good data misfit for 600+ sources each, which is not reflected in the joint inversion using the same sets of sources.
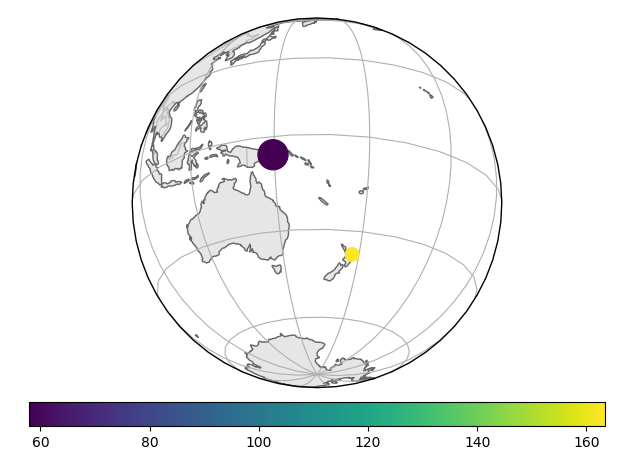
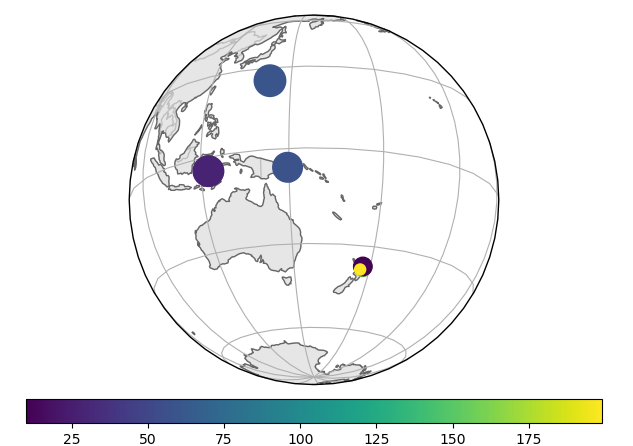
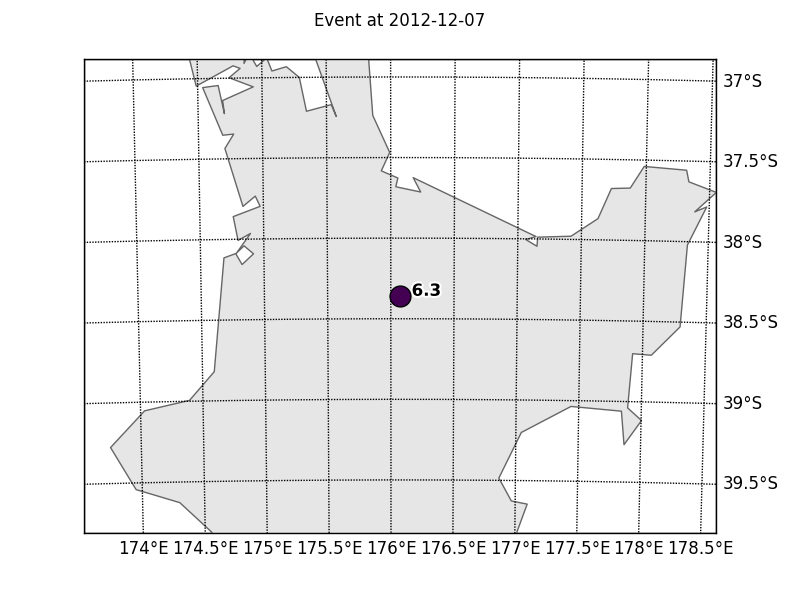
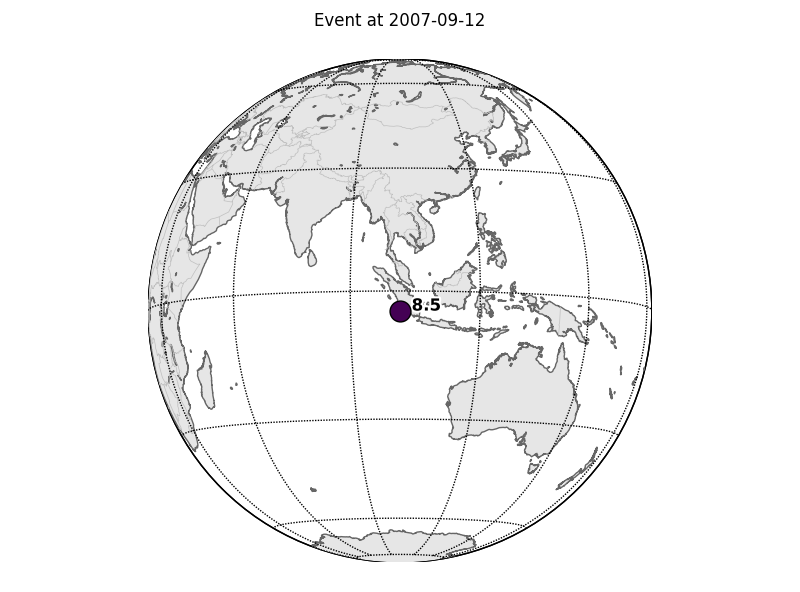
In this post we perform the simplest case of joint inversion using one source each and with no regularization to examine the aforementioned observation. For the local inversion we use one event from central North Island, while the teleseismic source is an event in the Sumatra subduction zone.
- local source
- teleseismic source
local
Of the local source, eight iterations of inversion step shows that the root-mean-squared residual misfit decrease significantly from 212 to 0.31 ms.
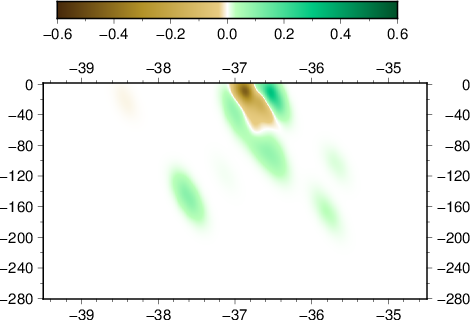
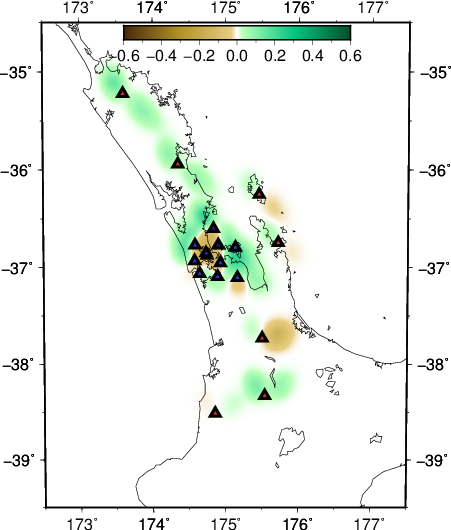
The associated model recover a pair of checker-board cube around 37 S/175 E.
- initial checker-board depth slice
- recovered checker-board at 18 km
- initial checker-board EW slice
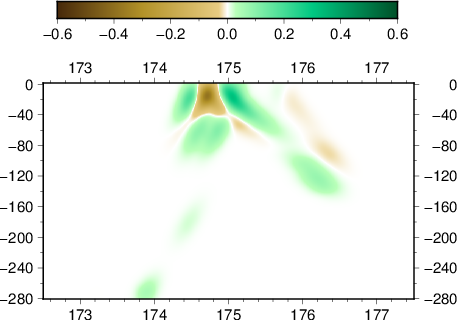
- recovered checker-board at 36.85 S
- initial checker-board NS slice
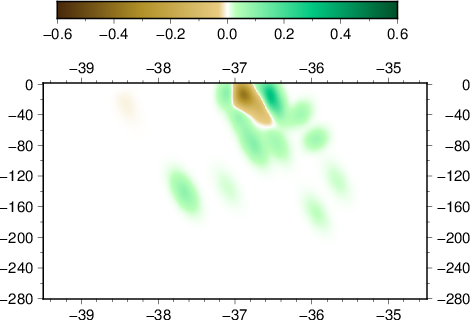
- recovered checker-board at 174.75 E
teleseismic
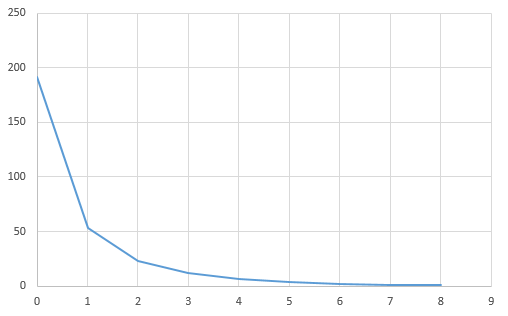
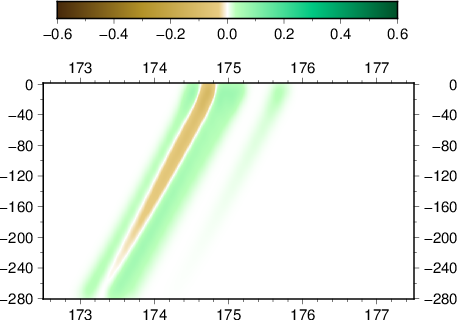
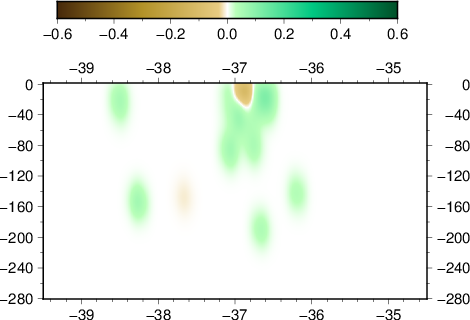
Similarly, eight iterations of the teleseismic source inversion shows that the rms residual decrease from 191 to 0.71 ms.
The recovered model is highly smeared especially in the EW direction. However it can still resolve patterns at shallow depth <30 km.
- initial checker-board depth slice
- recovered checker-board at 18 km
- initial checker-board EW slice
- recovered checker-board at 36.85 S
- initial checker-board NS slice
- recovered checker-board at 174.75 E
joint
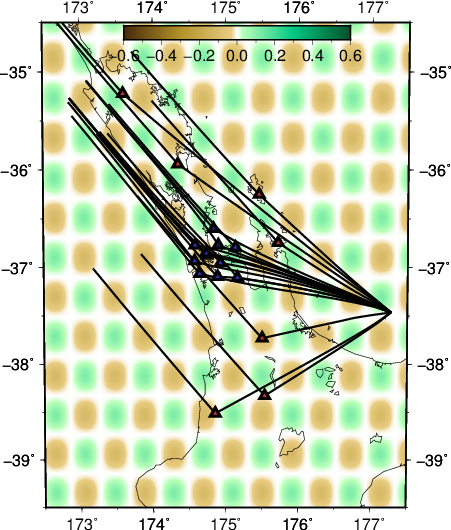
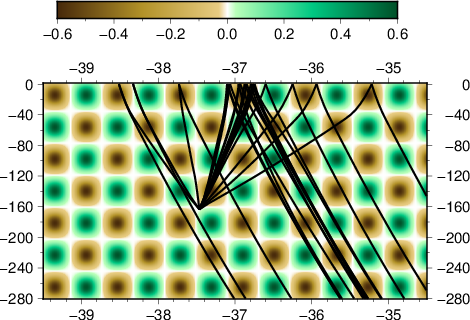
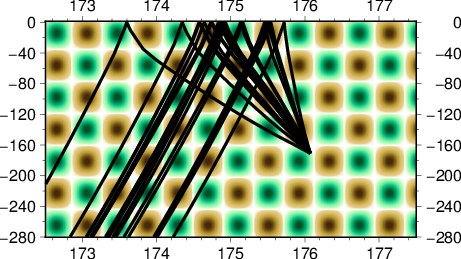
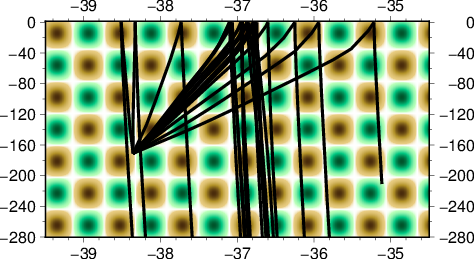
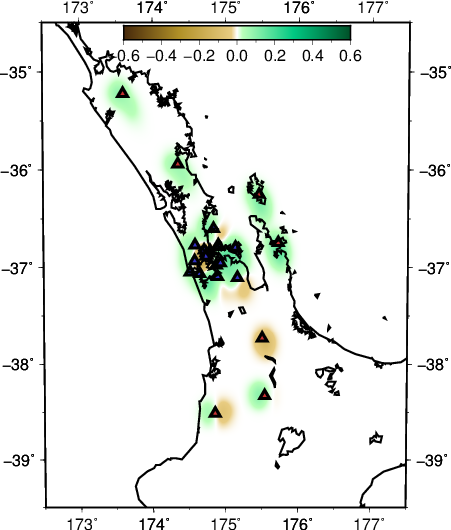
The ray-paths projected shows that the paths of the two sources are hardly overlapped.
- depth slice at 18 km
- EW slice at 36.85 S
- NS slice at 174.75 E
Eight iterations of the joint inversion shows that the misfit is reduced as well as the two individual cases (rms residual from 202 to 0.43 ms).
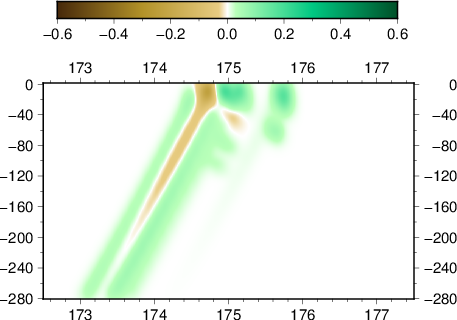
The resulting model recover three boxes of checker-board pattern at shallow depth beneath the AVF, improving from both local and teleseismic inversion by increasing the depth penetration and lateral recovery.
- initial checker-board depth slice
- recovered checker-board at 18 km
- initial checker-board EW slice
- recovered checker-board at 36.85 S
- initial checker-board NS slice
- recovered checker-board at 174.75 E
This outcome tells that fundamentally the approach works as we expected. Next we test whether the addition of numerous sources and/or the usage of regularization contribute to the high misfit of the data.
