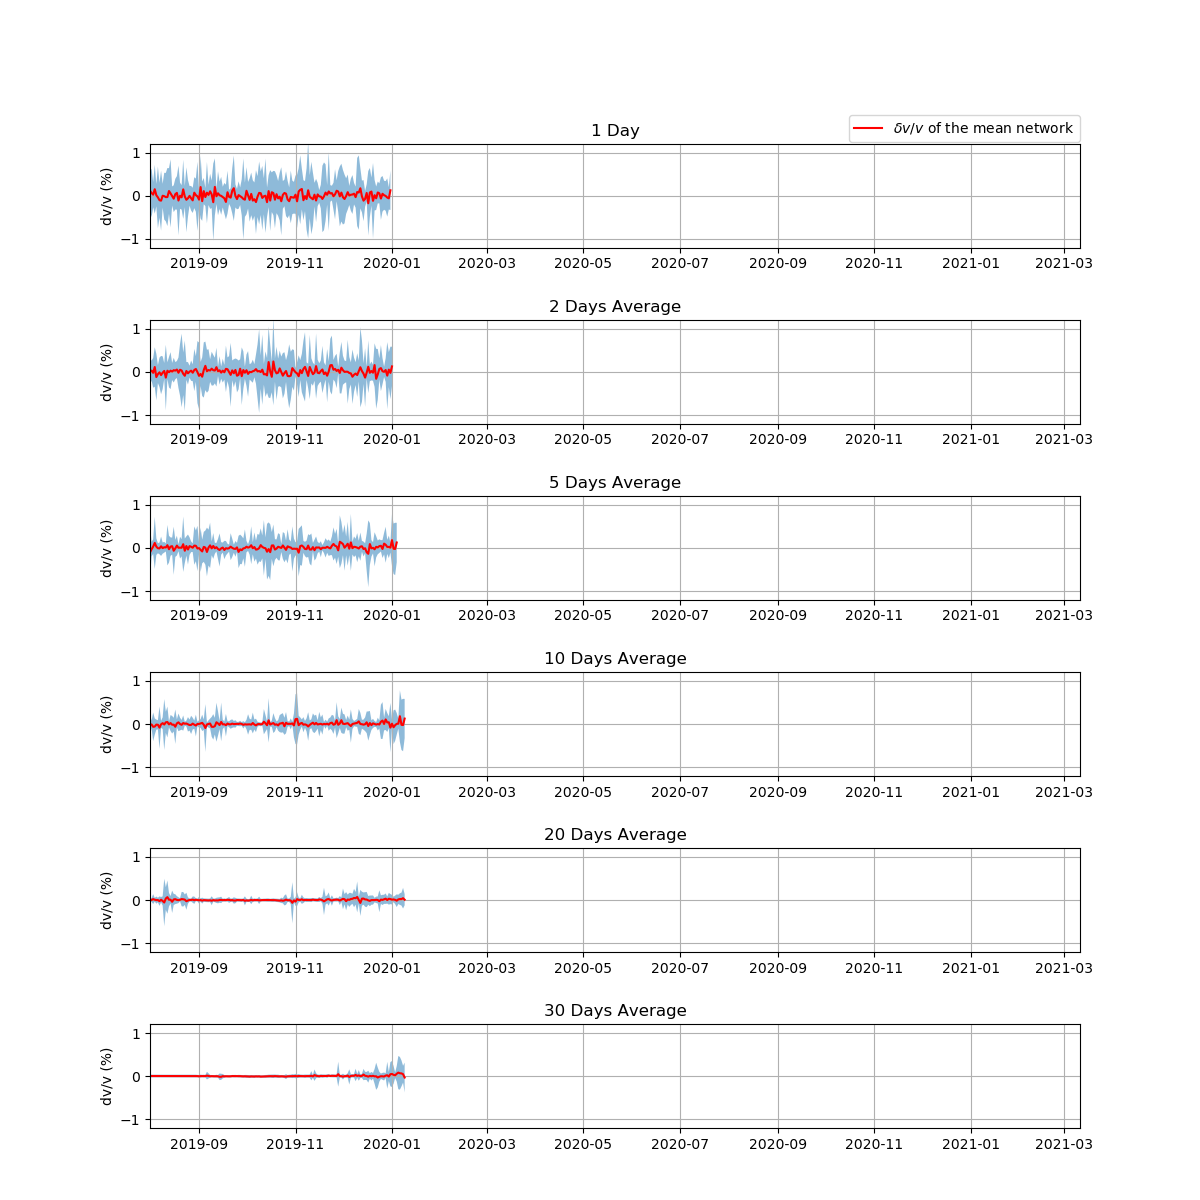
Above is a plot of the temporal seismic velocity in the AVF as found by using ambient seismic noise through the MSNoise package. At the moment this tool is 9 days behind the current date. The seismic data is downloaded from the Geonet FDSN archive service, which runs 7 days behind the present time to ensure the data is as complete as possible. To ensure we then get this complete data we only download the eighth day before the present. The plots can be viewed the next day, so after being uploaded they will always be 9 days behind. This process is repeated every day to build-up a complete image.
Gaps may be observed in the 1-day moving average. This is due to the data for a given day not being available for download 8 days after the date in question. If it is not available, it will manually be updated later. These gaps increase the variability of the plots, as what was a 5-day moving window is now only a 4-day moving window if there is no data for one of the five days.
A moving window is an average of the dv/v for each days of a given window length, ie a 30-moving window for the 30st of January will show the dv/v average for the 30 days from the 1st to the 30th. A larger window length means the dv/v values are averaged over a greater number of values, so will have a smoother curve over time.
What can be determined from these plots?
Based on a study done in White Island, rapid changes in dv/v were observed preceding eruptions. An incoming eruption compresses the ground above, changing the density of the earth, which can be reflected as changes in the dv/v plot. Currently this plot is unlikely to predict an eruption in time due to its 9 days latency along with a sizeable window length needed to observe any real change. However, it could be furthered to help current methods confirm an imminent eruption by reducing the latency. As Auckland has not experienced an eruption for a long time (~600 years), we don’t know for sure how an incoming eruption would impact the dv/v plots in the AVF.
An imminent eruption is not the only reason for variability in these plots. Changes to the material properties of the earth may be reflected in dv/v plots. In a study of Mt Merapi in Indonesia, seasonal changes to dv/v w coincided with changing groundwater levels. Another possible reason for changes in dv/v is variation to the source of energy for these experiments, the ocean. Storms out a sea alter the source and strength of the ambient seismic noise traveling through the earth, creating variations from normal.
Comments are closed.