Relative travel-time tomographic inversion is performed to the Auckland Volcanic Field (AVF), extending to include the northern parts of the North Island New Zealand. First P-wave arrivals are picked manually from earthquake traces that can be ranged in terms of quality. The travel-time residual between the picked arrival and the background ak135 1D-Earth model is the basis of this tomographic inversion.
stations
Eighteen stations are used in the inversion. The stations can be differentiated into the 11 that are centred to the city of Auckland, and the remaining 7 that surround the former array. For all of the stations, we are not using the low resolution channels.
-
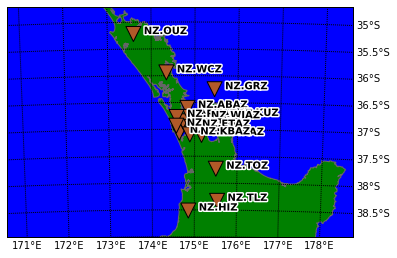
- all 18 stations
-
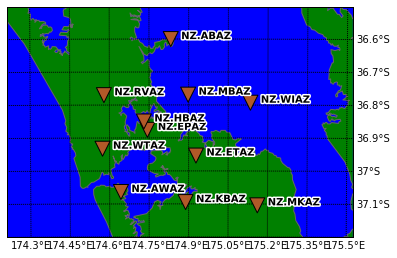
- 11 Auckland stations
events
The events that we use here can be separated into local and teleseismic events. The local events make up the sources that are originated from the South of the stations array. Meanwhile the teleseismic events, mostly from the pacifics, cover the illumination from the North.
There are 116 events sourced locally that we looked at. Most of these events have good trace data, but there are 4 events in which picking is not applicable due to the noise. From the remaining 112, some stations don’t show earthquake occurrence in the traces. This happened to the stations on the outside periphery, and the most times with station OUZ. We think that this may be related to the location of the stations. Station OUZ is the furthest station away from the sources, and thus the time window in which the traces are shown could be out of range here. All data that exhibit these situations are not considered for the inversion. Other traces that are regarded too noisy are also not included.

local events
Similarly with the teleseismic events, there are 121 events taken into account, 13 of which are discarded due to bad data. The same situation with the local data is also observed here. Station HIZ and OUZ at the two ends of the array are the most often disregarded from the inversion because of this. Again on top of all of this, if a trace data is too noisy it would also be discarded.

teleseismic events
iterations
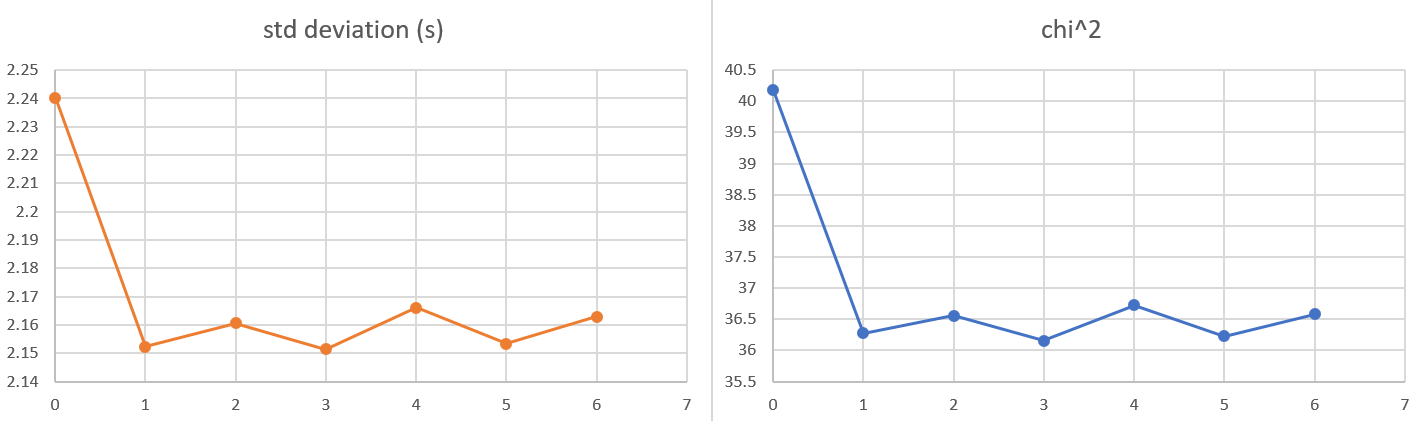
To assess the inversion performance, we plot the evolution of standard deviation (in seconds) and chi^2 throughout the iterative steps. We see that after 3 iterations, we won’t get any more significant improvement to the model.The graphs show that the overall improvement from the initial model is less than 10%. Relaxing the damping parameter does reduce the std deviation and chi^2 but only slightly. However doing so might introduce redundant features.
standard deviation and chi^2
inversion result
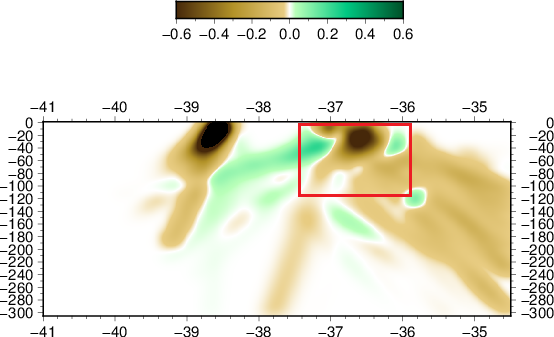
The following result is obtained after performing 3 iteration steps. We see that the Auckland Volcanic Field is at the edge of a predominantly negative velocity anomaly (in km/s). We are still unsure on what might have caused this observation. But the negative anomaly in Auckland is a characteristic for areas of active volcanic activity. For example in the southern extent of the model, the negative anomalies reflect the locations of Mt. Taranaki, and the Taupo Volcanic Zone.
-
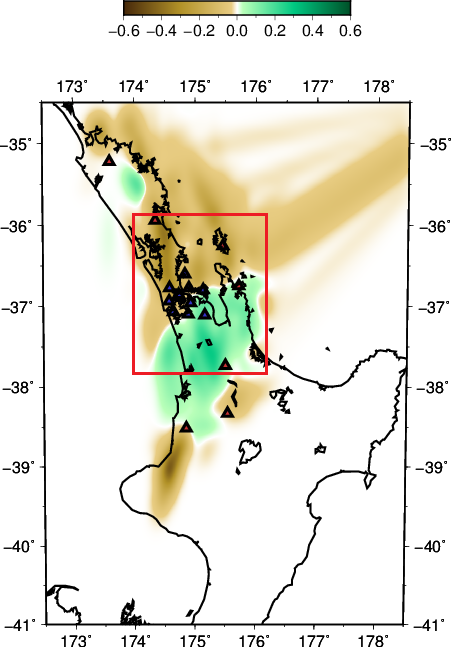
- depth slice at 60 km
-
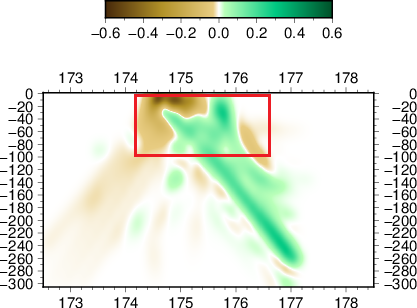
- EW slice at 37.0 S
-
- NS slice at 174.75 E
The red boxes signify the extent of our model that we’re most confident on. However it doesn’t mean that features outside of this box are all artefacts, they are simply less accurate due to the configuration of our sources and stations.
We add here the travel-time residual distribution for the initial and final model after 3 iterations. There is little change as explained by the standard-deviation analysis. The histograms are centred near zero, although we do have travel-times that are very late or very early.
Comments are closed.