Many years ago, Andrei Kurbatov asked us if we could do laser ultrasound on ice cores, during half time of an international football match we were watching in Golden, Colorado. Dylan Mikesell started these measurements in a home-made refridgerator in the Physical Acoustics Labd as a research project toward his undergraduate degree at Colorado School of Mines. We have come a very long way since, and today — with the additional help of Thomas Otheim and Hans Peter Marshall, our first paper on laser ultrasound on ice cores from Greenland and the Antarctic appeared in the journal Geosciences.
Category: PALNews (page 5 of 9)
Our collaboration with TU Delft has led to a new publication in the Journal of the Acoustical Society of America. Led by Joost van der Neut and Jami Johnson, this article adds the Marchenko equation to our tool set to image ultrasonic and photoacoustic data for medical applications. Perfect timing, Jami, for your PhD thesis defense tomorrow!
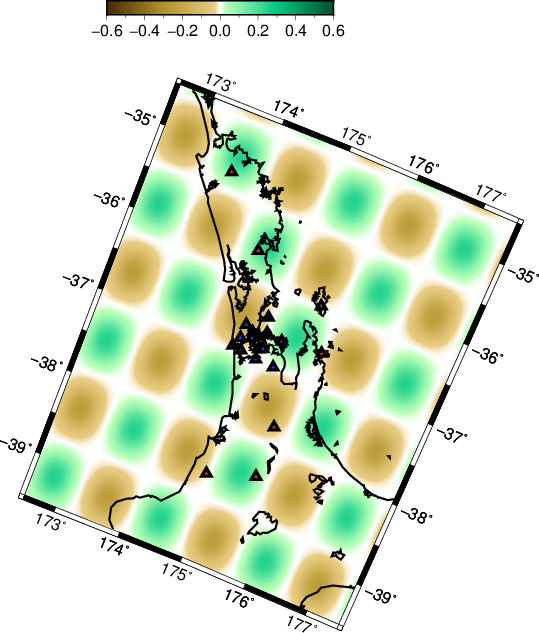
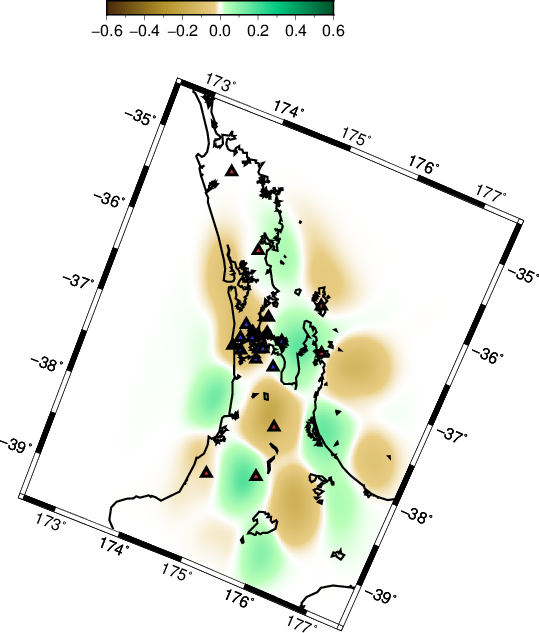
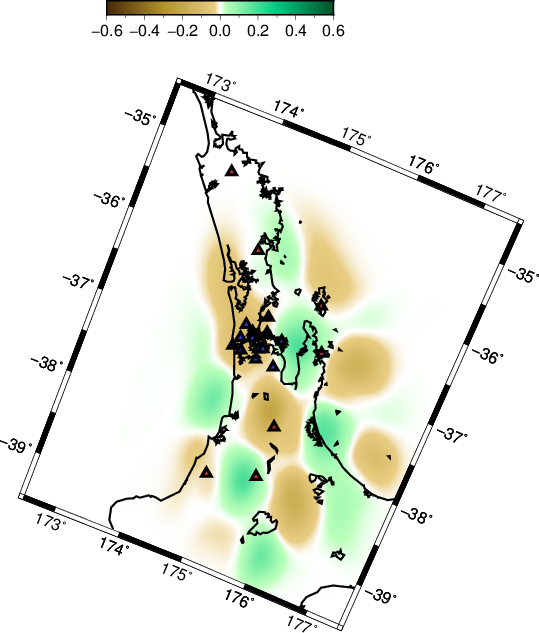
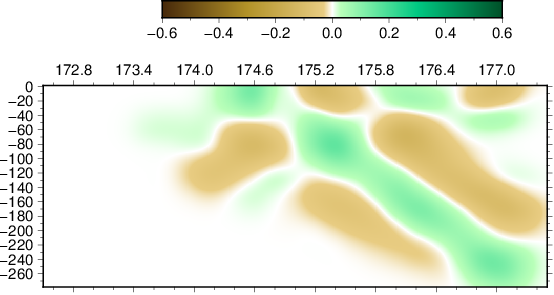
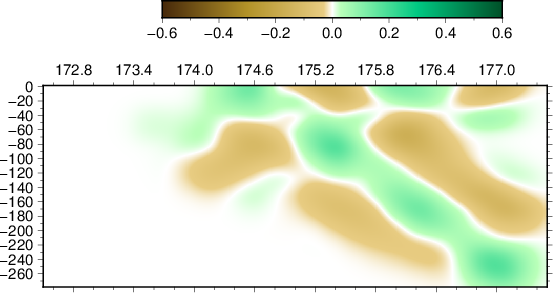
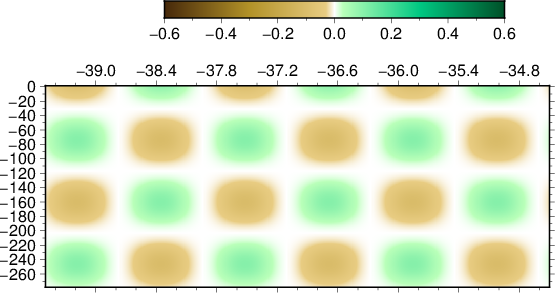
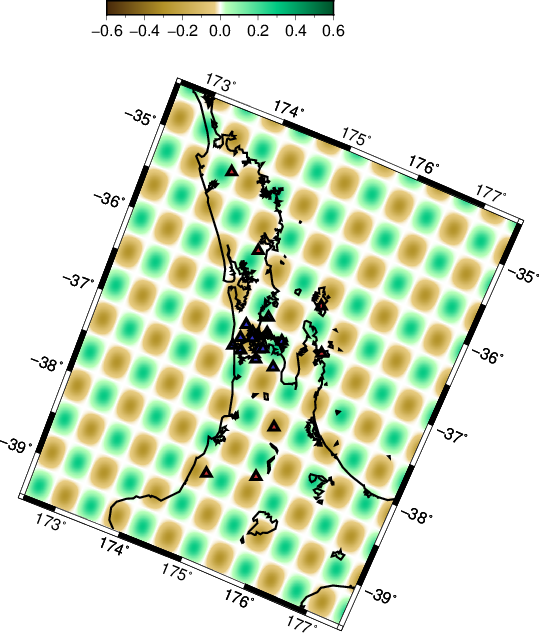
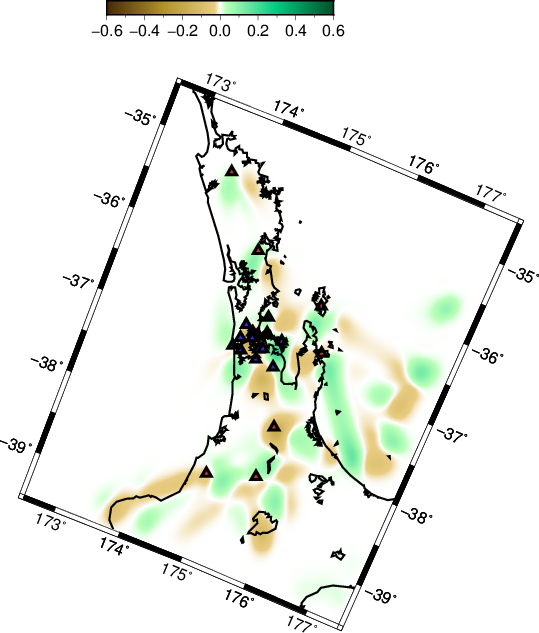
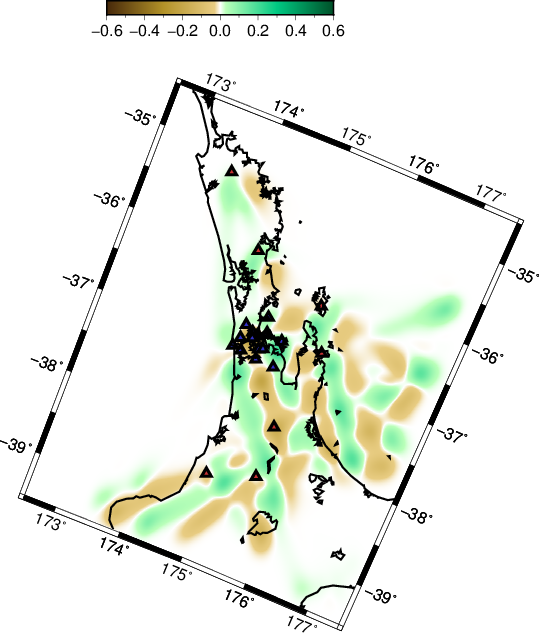
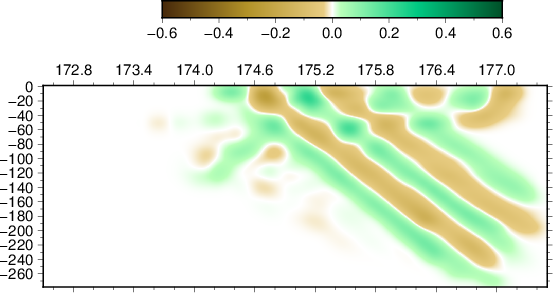
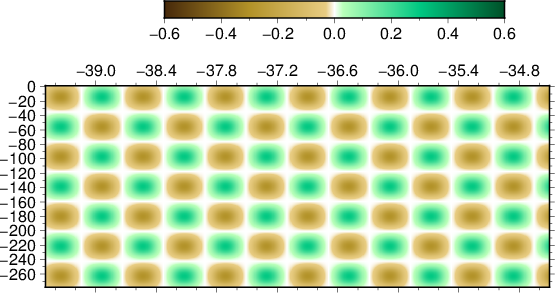
Following a resolution test of tomography of the AVF using global teleseismic sources, we perform a separate test considering the local events with Nick Rawlinson’s FMTOMO package.
The events considered have paths that involve direct and up-going waves (little p and s, as opposed to P and S in the teleseismic tomography).
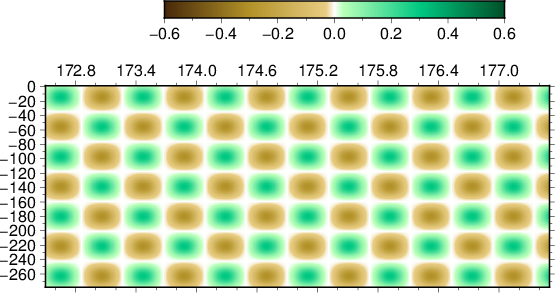
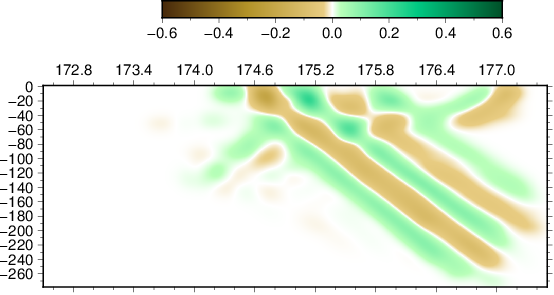
A depth slice at 90km resolves the checker-board pattern under the stations. Smearing is apparent in the latitudinal and longitudinal slices. There isn’t much difference in terms of the results between p- and s-wave inversion.
- Initial checker-board depth slice at 90 km
- Recovered checker-board P
- Recovered checker-board S
- Initial checker-board EW slice at 36.85 S
- Recovered checker-board P
- Recovered checker-board S
- Initial checker-board NS slice at 174.75 E
- Recovered checker-board P
- Recovered checker-board S
Using a finer checker-board
In order to resolve smaller scale structure in the subsurface, a finer scale checker-board was tested.
- Initial checker-board depth slice 20 km
- Recovered checker-board P
- Recovered checker-board S
- Initial checker-board EW slice -36.95
- Recovered checker-board P
- Recovered checker-board S
- Initial checker-board NS slice 174.75
- Recovered checker-board P
- Recovered checker-board S
The first 60 km in depth seem resolved in this test. However, deeper inversion results mostly add up to the effect of smearing. Unlike the S-wave results for teleseismic tomography, s-waves seem to benefit our regional tomography results.
Summary
- Features on the order of ~50km, are possibly recoverable up to 150 km deep, 174.2 to 176.4 longitudinally, and -36 to -37.8 latitudinally.
- Features half this size may be retreived up to 60 km down, 174.2 to 177.2 longitudinally, and -36.6 to -37.4 latitudinally.
- S wave tomography shows a better lateral resolution for the periphery of the stations. Most prominently with the finer scale checker-board.
Version 0.3 of PLACE represents a departure from prior versions. It has been rewritten from the ground up, with a strong focus on modular, object-oriented design. Additionally, the web interface for PLACE, which has been in development for some time, now serves as the primary interface to the application. Running on completely new architecture and design principles, it is hoped that PLACE can provide value to a much wider audience in the near future.
History
PLACE began as a collection of scripts and drivers used routinely in the Physical Acoustics Lab at the University of Auckland. In 2014, Jami L. Johnson, Henrik tom Wörden, and Kasper van Wijk bundled these scripts into a new Python-based laboratory automation package. Their paper, PLACE: An Open-Source Python Package for Laboratory Automation, Control, and Experimentation, demonstrated the strengths of modular design and provided a vision for the future development of PLACE. Development of PLACE continued at a constant rate until, early this year, there was enough desire for new features to support a redesign.
Core Design
The purpose of PLACE is to automate data acquisition in a laboratory setting by coordinating activity between laboratory instruments. Some of these instruments take measurements, while others facilitate the measurements.
As with prior versions of PLACE, version 0.3 uses an object called a Scan as the central component of the architecture and this object is responsible for organizing the series of actions that occur during data acquisition.
Where PLACE 0.3 differs from prior versions is in the way it handles instruments. Instruments are now viewed as completely autonomous modules, and the Scan object does not command their behavior. Instead, each instrument has its own configuration data and is only responsible for its own execution. This design means that plugins describing new instruments can be written without needing to know anything about what is happening in the rest of the system, leaving developers free to customize PLACE in unlimited new ways.
To interface with PLACE, an instrument need only worry about three events.
Event 1 – Configure Instrument
When a scan is started, the user provides PLACE with data describing the entire scan to perform. Configuration data that is provided for an instrument will be provided to the instrument during this phase. The instrument should use this data to ready itself for data acquisition to begin.
It may seem counter-intuitive for the Scan module to be unaware of what each instrument is doing, but it really isn’t necessary. The user knows what each instrument need to do, and the instruments each know what to do. The Scan module is simply holding the checklist, making sure everything happens at the right time.
Event 2 – Update Instrument
Updates occur one or more times during data acquisition. Again, the Scan module orchestrates these updates, ensuring each instrument receives the update command at the appropriate time. The instruments themselves need not worry about what other instruments are up to, and should only perform their portion of the experiment. For example, a thermometer would probably record the temperature on each update. Whether or not a laser is involved in another part of the data acquisition is of little consequence to the thermometer.
Event 3 – Cleanup Instrument
At some point, PLACE will stop performing updates. Perhaps something has gone wrong with one of the instruments, or perhaps data acquistion is simply finished. In any case, this is where the instrument should wrap up. If it has been saving data, perhaps this is where it will write that data to disk. If it has locked a hardware or software resource, this is where it should be freed. You’re still here? It’s over. Go home.
JSON and the Arguments
For PLACE 0.3, the dashed argument style conventionally used in Linux programming has been abandoned for a single, more verbose, JSON-formatted, string argument. As with many decisions for PLACE 0.3, it came down to modularity. Supporting an unlimited number of instruments would mean supporting an unlimited number of command-line arguments, which is, frankly, not possible. JSON provides verbosity and portability. JSON-formatted data acquisition configurations are easy to understand and highly portable.
Consider the following configuration:
{
    "scan_type": "basic_scan",
    "updates": 180,
    "filename": "sample7403.h5",
    "comments": "24 May 2017",
    "instruments": [
        {
            "module_name": "alazartech",
            "class_name": "ATS660",
            "priority": 100,
            "config": {
                "clock_source": "INTERNAL_CLOCK",
                "sample_rate": "SAMPLE_RATE_10MSPS",
                "clock_edge": "CLOCK_EDGE_RISING",
                "decimation": 0,
                "analog_inputs": [
                    {
                        "input_channel": "CHANNEL_A",
                        "input_coupling": "DC_COUPLING",
                        "input_range": "INPUT_RANGE_PM_2_V",
                        "input_impedance": "IMPEDANCE_50_OHM"
                    }
                ],
                "trigger_operation": "TRIG_ENGINE_OP_J",
                "trigger_engine_1": "TRIG_ENGINE_J",
                "trigger_source_1": "TRIG_EXTERNAL",
                "trigger_slope_1": "TRIGGER_SLOPE_POSITIVE",
                "trigger_level_1": 128,
                "trigger_engine_2": "TRIG_ENGINE_K",
                "trigger_source_2": "TRIG_DISABLE",
                "trigger_slope_2": "TRIGGER_SLOPE_POSITIVE",
                "trigger_level_2": 128,
                "pre_trigger_samples": 0,
                "post_trigger_samples": 1024,
                "averages": 16,
                "plot": "yes"
            }
        },
        {
            "module_name": "xps_control",
            "class_name": "LongStage",
            "priority": 20,
            "config": {
                "start": 10,
                "increment": 0.25
            }
        }
    ]
}
As can be imagined, managing the configuration options for even a few instruments would be cumbersome using command-line parameters, and would prove impossible with a large enough set of instruments. The new process provides good documentation of configurations and supports an endless number of instruments, using any number of parameters.
Despite the strengths of the JSON configuration, it is easy to see that PLACE is more difficult to execute from the command prompt. To combat this, the command supports JSON configuration files, which will allow users to edit and save scans without the pressure of writing correct JSON into the terminal. Additionally, the web interface for PLACE is now up and running, providing a point-and-click method for generating data acquisition configuration data.
PLACE Web Interface
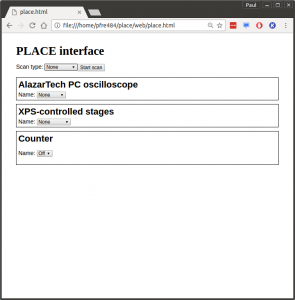
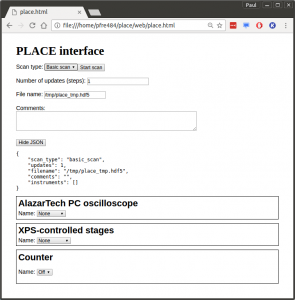
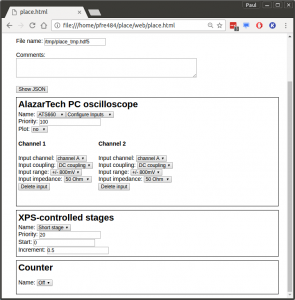
Generating the configuration data for data acquisition with PLACE is simplified by using the PLACE web interface. Like the PLACE source code, the web interface is also modular, meaning the interface is built of smaller webapps, each responsible for the configuration of one piece of the experiment. At the top of the interface, the options for data acquisition are configured. Below that, individual boxes control the configuration options for each active instrument.
JSON configuration data is generated for each instrument and, optionally, viewable at the top of the web interface. Typically, calling “Start scan” will send the JSON data to PLACE, but the web interface can also be used to generate configurations that can be saved to a file for execution at a later point.
Instruments that are needed for the desired data acquisition can be activated within the web interface, and the nested webapp module for the instrument will present the options available. The JSON configuration data generated for the instrument is continually updated in the scan module.
The web interface itself is JavaScript, but the JavaScript is generated from the Elm programming language. Therefore, developing a plugin for the PLACE web interface is as simple as writing a basic Elm module, and the PLACE repository provides the well documented Counter instrument for use as a template.
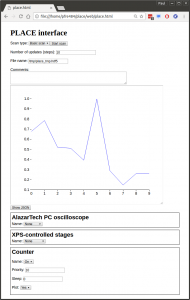
In addition to setting configurations, the web interface maintains a socket, through which instruments can return data to be displayed in the web interface. This is intended for plotting data, but any HTML data should be displayed without much issue. The Counter instrument demonstrates this feature with dummy data.
Current Implementation
As of today, the current version of PLACE is version 0.3.1. The Scan module currently provides access to “basic scans” which means an experiment with any number of updates, socket access to the web interface plot, and data written to an HDF5 file specified by the user. Basic use of the AlazarTech 660 and 9440 oscilloscope cards is supported. Two stages, a long and a short, are supported through the Newport XPS C8 controller. A software Counter provides testing, demonstration, and other support features. It could also be useful for recording the current update count during data acquisition and/or injecting arbitrary sleep times between update rounds.
Additional instruments are expected to be added in the near future. Current priorities include additional stages and a vibrometer. Support for more advanced results visualizations will also be added in the near future.
Our youngest PAL, Jonathan Simpson, has been working this summer on performing laser ultrasonics on rocks in our pressure vessel. This semester, Jonathan will embark on a BScHons thesis in our group. Today, he was awarded the S. J. Hastie Scholarship by the Geoscience Society of New Zealand. We congratulate Jonathan, and wish him good luck in his BScHons project on leaky modes in the Hikurangi Trench!
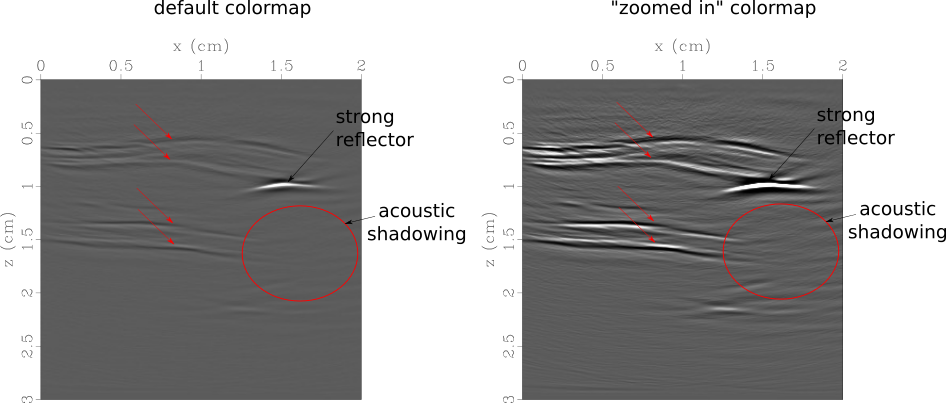
The latest issue of the Journal of Biomedical Optics features an article led by Jami Johnson, in collaboration with our good friend Jeffrey Shragge (from the University of Western Australia). In it, we apply some the latest tricks stemming from seismology to medical imaging of arteries. This particular publication focuses on theory and numerical simulations, but below you can see the first scan of an ex-vivo artery in the Physical Acoustics Lab!
The March issue of The European Journal of Physics features a review article on Ru: the seismic network of school seismometers in New Zealand. The journal (and hence our paper) targets Physics students in their final year(s) in secondary education, or early tertiary education, but we hope it appeals to a broad range of readers! On a side note, this work was co-authored by our youngest of PALs: geophysics undergraduate student Jonathan Simpson.
We thank all of the Ru teachers and students who participate, and particularly the EQC and the SEG Foundation for their support.
This is an intro to some basic tasks in seismology, performed in the python package obspy. Obspy has extensive documentation, tutorials and even a sandbox to play in, but if you are completely new to obspy, you may find the following useful.
Installations
I am going to assume you only have python on your computer, but if you have obspy and jupyter running, you can skip this section.
To get the necessary packages, I strongly encourage the use of the conda package manager. To install conda, go here.
After that, getting different python packages is a breeze. To get 2D plotting tools from matplotlib, type on the command line:
conda install matplotlib
cartopy can be used to plot maps (there are others, such as basemap):
conda install cartopy
To get obspy, follow these simple instructions.
The following tutorials will be run in jupyter:
conda install jupyter
After this, you can run a jupyter notebook, by typing on the command line:
jupyter notebook nameofyournotebook.ipynb
These notebooks are meant to illustrate the use of obspy, in this case, but you can export the results of a jupyter notebook to html, or pdf, and even to a .py file, as a “clean” python programme.
Workflow
Let’s break down a basic seismology workflow into the tasks below. Each is a hyperlink to a notebook.
- Building a catalogue of Earthquakes first notebook, run “jupyter notebook create_catalogue.ipynb”,
- Creating an inventory of stations — with their instrument response — that recorded these events,
- Retrieving seismic data from the stations in the inventory from the events in the catalogue, and performing an instrument response correction.
Our own Josiah Ensing won the 2016 Sagar Geophysics Prize (shared with Nick Edkins), for his MSc Thesis on imaging the Auckland Volcanic Field. We congratulate Josiah, and look forward to learning what accolades his PhD research will bring!
 Today, research in collaboration with the University of Otago was published in The Cryosphere. In it, we monitor the temperature dependence of the elastic properties and the attenuation constant of ice, based on resonance measurements in the Physical Acoustics Lab. In the image at the top you can see how resonant peaks shift and attenuate with increasing ice temperature. Our work will hopefully aid the interpretation of elastic wave measurements on ice sheets and glaciers. We thank Matthew Vaughan, as well as fellow co-authors David Prior and Hamish Bowman, for making this project a success: truly some of our “coolest” work to date.
