Author: kvan637 (page 8 of 8)

A deep earthquake on the eastern margin of the Australian plate

Yesterday, we recorded seismic waves on our station AUCK from an Earthquake roughly 11 degrees to our North. This event is characterized by a strong P- and S-wave arrival as you can see in this figure:

fiji65_AUCKdata

Given the usual limitations of our (vertical) sensor when it comes to S-wave recordings, this is indicative of a very deep earthquake. The USGS estimates that this earthquake happened at a depth of 460 km. Now, under most places on Earth the rocks at those depths are too ductile to support the brittle breaking necessary for an earthquake, but in this case, the earthquake happened in — or on the boundary of — the brittle Pacific Plate subducted under the Australian Plate. Note that the epicentre of this event is about 500 km from the surface expression of the boundary between these plates. From the depth of the event and the offset to the plate boundary at the surface, we can estimate the angle of subduction may be around 45 degrees.

FIJI65_2014epicentre

The P- and S-wave markers are based on the average wave speed in the earth. In this case, they are a bit earlier than expected, because the subsurface between earthquake and the AUCK recording station is slower than average. As discussed previously, this is indicative of a young, warmer (and thus slower) lithosphere.

Furthermore, such deep earthquakes cause relatively little surface wave energy. The signal after the S-waves is likely a guided wave in the Pacific plate called a “leaky mode.” If you want to learn more about leaky modes in the Kermadecs, you should read this paper.

Our computing environment

As 21st century researchers, we have access to a tremendous amount of software to practice our trade. In fact, it seems every day new software appears (and some old favourites go out of style, or cease to be supported).  Below is a list of my personal favourites. The common thread here is that these are all open-source software. The reason for this is that open-source software is community supported (and often community-built). There is no messing around with the license files,  there are no black-box results (you have the source code) and even if your institution could afford the commercial programme, maybe your collaborators cannot. Or you can’t run it on your computer at home. By the way, while I shortly will advocate for the linux computer operating system, the software we list is all platform independent.

  • Our operating system of choice is linux. While there is still a bit of a learning curve, installing and learning linux these days is easy. Certainly easier than it was! As is maintenance and upgrading with tools such as apt-get and dnf. There are many flavours of linux, and the differences are really not that great. Within linux, emacs is my personal favorite text editor, but there are plenty of other good ones. Gone are the days of straight-up vi!
  • Our computer programs are in python, using scipy and numpy. Python is growing so fast that every time I look, there is another new part to python that makes the life of a researcher easier. Processing seismic data was done in SAC or Seismic Unix, but now there is obspy. Making maps without the commercial GIS software required Generic Mapping Tools, but now python with matplotlib, basemap and cartopy ensure vectorised figures and maps. In experiments, we control the hardware in our lab with python. Commercial options such as Labview and matlab are simply obsolete.
  • Document processing is done in LaTeX. You can spot a LaTeX document from a mile away by its beautiful layout, fonts, figures, and maybe most importantly: its equations. Figure labels, section headings, equation numbers are all dynamically linked, making editing a breeze. With only a few lines difference, you can turn a paper into a presentation or a poster, too. Libreoffice, which used to be openoffice, is not bad, but often does not map one-to-one between commercial versions of Word.
  • We draw in inkscape. I love all the vectorized plotting options, and LaTeX implementations with pdf outputs. Wow! Even an awful drawer like me can make something look decent.
  • We tinker with arduino. Projects on school seismometers and a so-called bat-hat for a local museum rely on the wonderful open-hardware that is arduino. We foresee arduinos taking over simple lab tasks in the near future.

Our "seismometers in schools" project received SEG support and is in the news

One of our favourite projects in the Physical Acoustics Lab involves outreach and education in seismology with the TC1 seismometer. This week has been a good week, as we were informed that the Foundation of the Society of Exploration Geophysicists (SEG) will support the instrumentation of a number of NZ schools with seismometers. In addition, Ian Randall wrote a wonderful article on the topic in Physics World.

M6.3 earthquake, 15 km east of Eketahuna

greatcircle

 
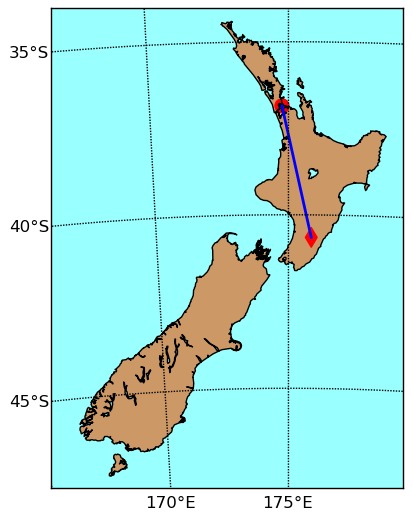
In the Science Centre of the City Campus of the University of Auckland we record seismic waves with the TC1 seismometer. Routinely, our station AUCK records seismic waves from earthquakes in New Zealand and beyond. On January 20th, 2014, an earthquake occurred on the South side of the North Island, 15 km east of Ekatahuna. Here is a map of the epicentre, our station location, and the great-circle path between them.


2014-01-20-02-52-44

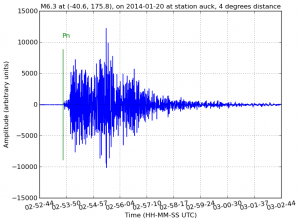
On the left you can see 10 minutes of recordings, starting at the origin time of this earthquake. The green marker annotated with a Pn is the predicted arrival of the first wave traveling 4 degrees from the epicentre, 15 km east of Eketahuna, to Auckland. This prediction is based on a spherically symmetric model of the Earth, by Brian Kennett, and certainly seems to mark the start of minutes of vibrations in Auckland from this earthquake. In fact, if you look carefully you see that the wiggles after 10 minutes are still larger than before the first wave from this earthquake arrived. Larger earthquakes can make the Earth “ring” for many hours.

2014-01-20-02-52-44_zoom
In the image on the right, we zoomed in on the first-arriving wave, almost exactly one minute after the earthquake originated. Now, you can see that the prediction is actually a few seconds before the arrival. This means the lithosphere under the North Island of New Zealand is a bit slower (~3% on this path) than the average on Earth. In general, a hotter lithosphere is slower than a cold one. This makes seismic waves traversing old, cold, continents relatively fast, and those sampling younger lithosphere like ours in New Zealand, relatively slow.

In general, it is these small travel time differences that provide images of the (deep) earth through a process called seismic tomography.

Our paper on photoacoustics came out

Today, the manuscript based on Jami Johnson’s research in medical imaging with photo-acoustic waves came out. Congratulations, Jami! You can find the paper here. For a complete list of the publications of members of the Physical acoustics lab, including pdf reprints, visit our pubs page


Open PhD position in the Physical Acoustics Lab

Seismic methods are commonly used to characterize reservoirs of all kinds. Micro-seismic events are an example of remote sensing of the reservoir.
In previous research, we reported on the distinction of seismic events that were originally clustered based on their distinct P- and S-waves. This involved a correlation technique in the frequency domain. In this postgraduate research project, we are going to tackle the following questions:

  • What are there specific data requirements for the new spectral identification to work?
  • Are there particular wave modes (for example, head waves) responsible for characteristic power spectra?
  • Does an analysis in the time domain shed further light on separation of seismic events in “a cloud”?

Fees and a stipend are provided by the Physical Acoustics Lab, thanks to the generous support of the Schlumberger’s Gould Research Center, Cambridge, UK.

RUS

Resonance Ultrasound Spectroscopy (RUS) uses the normal modes of an oscillating body to determine its elastic parameters. It allows the complete tensor to
be determined from a single measurement.

It fits an experimental gap between low frequency stress-strain measurements and high frequency time of flight experiments and deals with frequencies at the high end of those relevant to geophysical applications. It is a nondestructive method that can be used on small, rare or hard to obtain samples.

We moved 11362.76 km

Dear All,

A lot has happened since our last posting. Thomas Blum is a Dr. Blum now, and oh, yes: The Physical Acoustics Lab moved from Boise, Idaho, to the University of Auckland in New Zealand!

processing flow


#!/bin/sh

## this is the flow of processing steps for two purposes: 1) we add
## data to our database for research purposes. 2) we transform the ZIP
## files to the format IRIS wants them

# First step: your zip files collected in the field on date
# $servicedate are in
# /pal/fieldcamp/2011/passive_seismic/data/$servicedate/raw (and the
# Service Forms should digitized and stored in the same directory)

. /opt/antelope/5.1-64/setup.sh # run the antelope setup for the path
# to antelope functions.

# Our network code is:
NET=XN

# Our database we call:
dbname=neal_HS

servicedate=20120405

########### setup to correct directory structure ##########################
mkdir $servicedate/mseed # location for mseed files after extracting
# with unchunky (in rt2ms)
mkdir $servicedate/logs # location for *.log, *.err, and *.run files
mkdir $servicedate/day_volumes # day-long miniseed files after running
# miniseed2days. It is these files you
# FTP to IRIS.

###########################################################################
# this next section only necessary the first time you process data:
# copy the needed files to correct directory
#/bin/cp -f /pal/fieldcamp/2011/passive_seismic/codes/batchfile.pf .

# convert batch to parameter file:
#batch2par batchfile.pf > par_file_tmp.pf

# EDIT THE refstrm COLUMN to all 1s:
#sed 's/rs250spsrs/1/' par_file_tmp.pf > parfile.pf
#rm -rf par_file_tmp.pf
##########################################################################

# make a list of all zip files in the directory:
ls $servicedate/raw/*.ZIP > list.file

# convert the zip files from the reftek (rt) to miniseed (ms):
rt2ms -F list.file -p parfile.pf -o $servicedate/mseed/ -R -L

# so the next service date can be processed, make sure that:
rm -rf list.file

##########################################################################
# The next section is to convert the log files to mseed LOG files:
# log2miniseed needs some parameters changed from the default, before
# running:
/bin/cp -f $ANTELOPE/data/pf/log2miniseed.pf .

# this makes sure the LOG files get into the proper day_volumes
# directory to go with the data:
sed "/wfname/ c wfname $servicedate/day_volumes/%{sta}/%{sta}.%{net}.%{loc}.%{chan}.%Y.%j" log2miniseed_tst.pf

mv -f log2miniseed_tst.pf log2miniseed.pf

# script to convert log files to miniseed, for all log files in the
# mseed directory:
for file in `ls $servicedate/mseed/*log`
do
# first, we need establish the serial number of each file:
srnmb=`echo $file | awk -F . '{print $6}'`
# then, map serial number to station name:
case $srnmb
in
9477) log2miniseed -a -n XN -s PS01 $file;;
9261) log2miniseed -a -n XN -s PS02 $file;;
92C3) log2miniseed -a -n XN -s PS03 $file;;
984E) log2miniseed -a -n XN -s PS04 $file;;
9559) log2miniseed -a -n XN -s PS05 $file;;
9294) log2miniseed -a -n XN -s PS06 $file;;
956E) log2miniseed -a -n XN -s PS07 $file;;
9924) log2miniseed -a -n XN -s PS08 $file;;
9144) log2miniseed -a -n XN -s PS09 $file;;
9098) log2miniseed -a -n XN -s PS10 $file;;
929B) log2miniseed -a -n XN -s PS11 $file;;
esac
done
# note that PS11 changed RT130s early in the project!
##########################################################################

# move the raw log and err files out of the mseed directory:
mv $servicedate/mseed/*log $servicedate/mseed/*err $servicedate/logs/

# to build the antelope database do the following. DON'T DO THIS, if you
# are adding data to an existing database:
#dbbuild -b $dbname ./batchfile.pf >& dbbuild.out

# use "dbe $dbname" to look at the database to make sure it is sound

# link the waveforms to day_volumes for IRIS:
miniseed2days -Du -d $dbname -w "$servicedate/day_volumes/%{sta}/%{sta}.%{net}.%{loc}.%{chan}.%Y.%j" $servicedate/mseed/ >& msd2days.out

################################################################################
# the rest is just checking the integrity of the database:

# asign calibration values from the calibration table:
dbfix_calib $dbname

# verify the correlation of your data and database:
dbversdwf -tu $dbname
dbverify -tj $dbname >& dbverify.out

# create the dataless SEED volume (ONLY ONCE!). The dataless SEED volume, often
#referred to as a "dataless", contains the meta-data describing the
#station and instrumentation of your experiment. To generate the
#dataless SEED volume, run mk_dataless_seed, which builds the dataless
#from the contents of your experiment's database. You will submit this
#file along with the waveforms to PASSCAL. (should be named with the
#*current* date):

#outputfile=$NET.`date +%y`.$dbname.`date +%Y%j%H%M`.dataless

# make the dataless SEED volume:
#mk_dataless_seed -v -o $outputfile $dbname

# check the structure of the dataless SEED with
#seed2db -v $outputfile