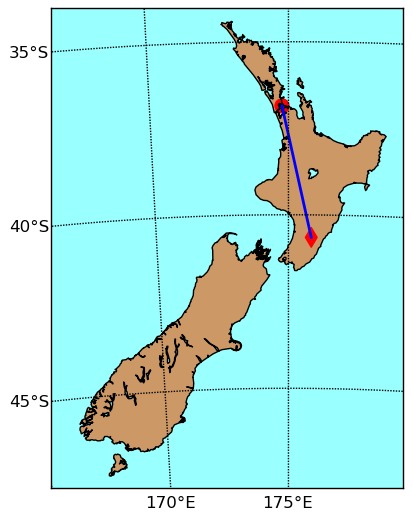
In the Science Centre of the City Campus of the University of Auckland we record seismic waves with the TC1 seismometer. Routinely, our station AUCK records seismic waves from earthquakes in New Zealand and beyond. On January 20th, 2014, an earthquake occurred on the South side of the North Island, 15 km east of Ekatahuna. Here is a map of the epicentre, our station location, and the great-circle path between them.
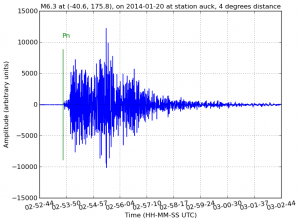
On the left you can see 10 minutes of recordings, starting at the origin time of this earthquake. The green marker annotated with a Pn is the predicted arrival of the first wave traveling 4 degrees from the epicentre, 15 km east of Eketahuna, to Auckland. This prediction is based on a spherically symmetric model of the Earth, by Brian Kennett, and certainly seems to mark the start of minutes of vibrations in Auckland from this earthquake. In fact, if you look carefully you see that the wiggles after 10 minutes are still larger than before the first wave from this earthquake arrived. Larger earthquakes can make the Earth “ring” for many hours.

In the image on the right, we zoomed in on the first-arriving wave, almost exactly one minute after the earthquake originated. Now, you can see that the prediction is actually a few seconds before the arrival. This means the lithosphere under the North Island of New Zealand is a bit slower (~3% on this path) than the average on Earth. In general, a hotter lithosphere is slower than a cold one. This makes seismic waves traversing old, cold, continents relatively fast, and those sampling younger lithosphere like ours in New Zealand, relatively slow.
In general, it is these small travel time differences that provide images of the (deep) earth through a process called seismic tomography.
Comments are closed.