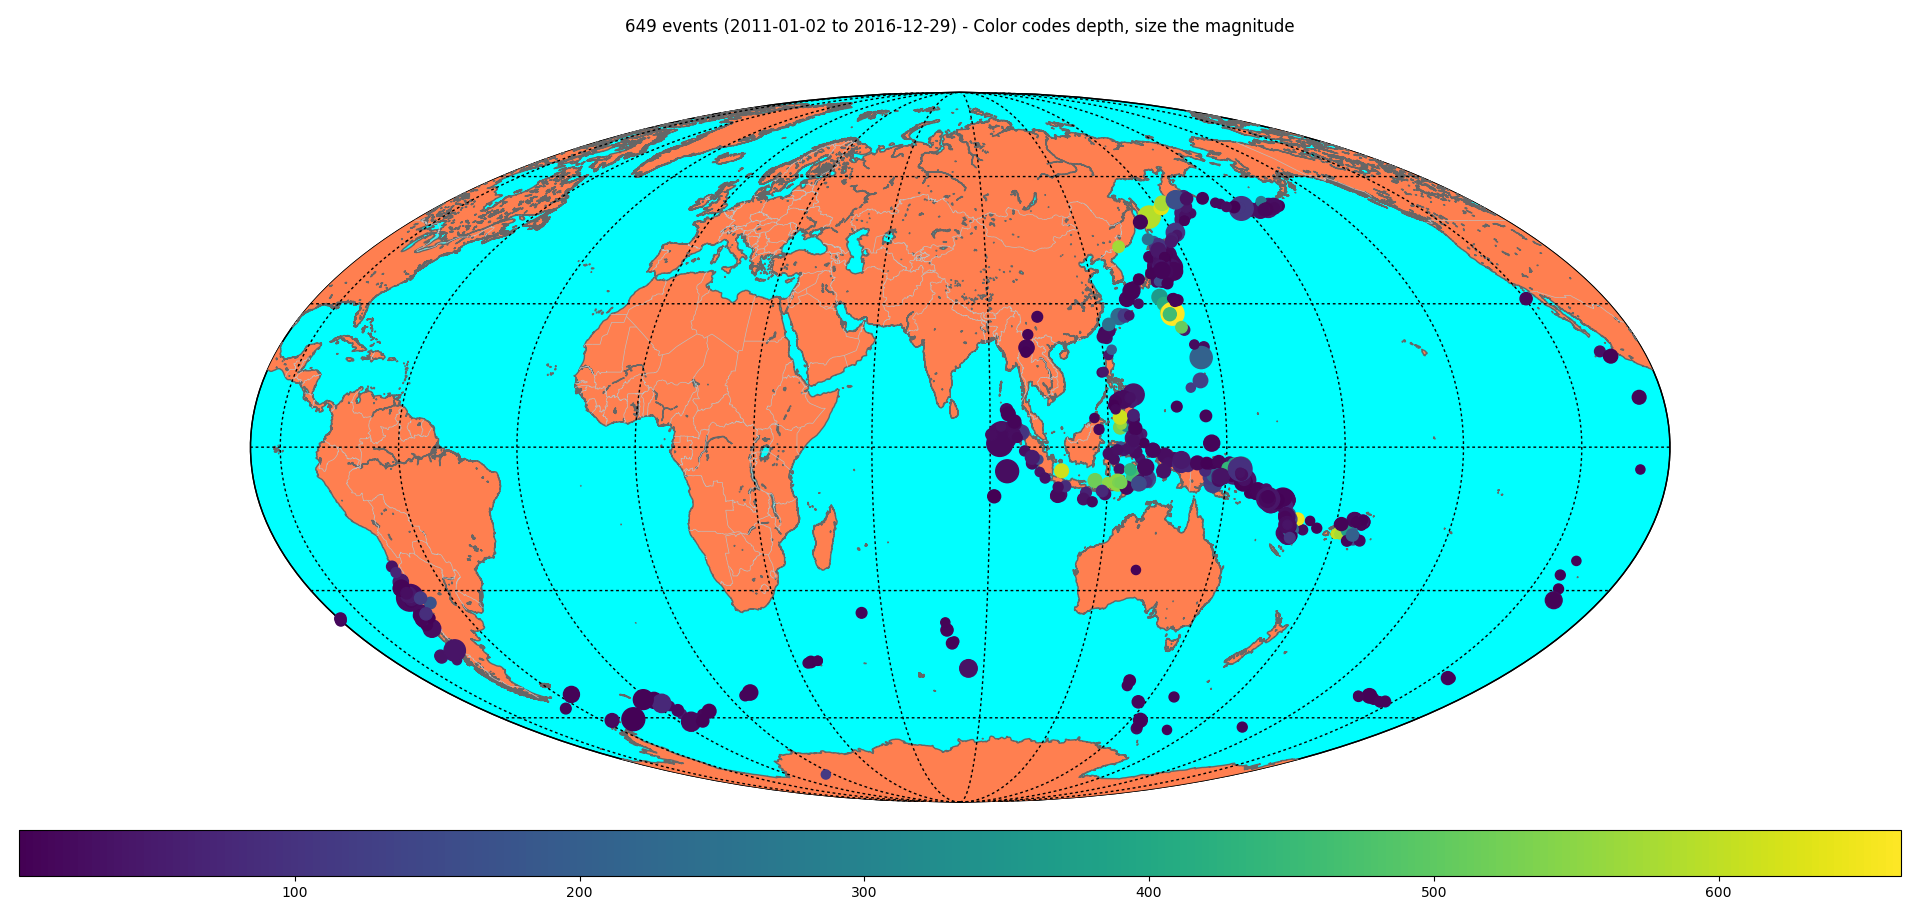
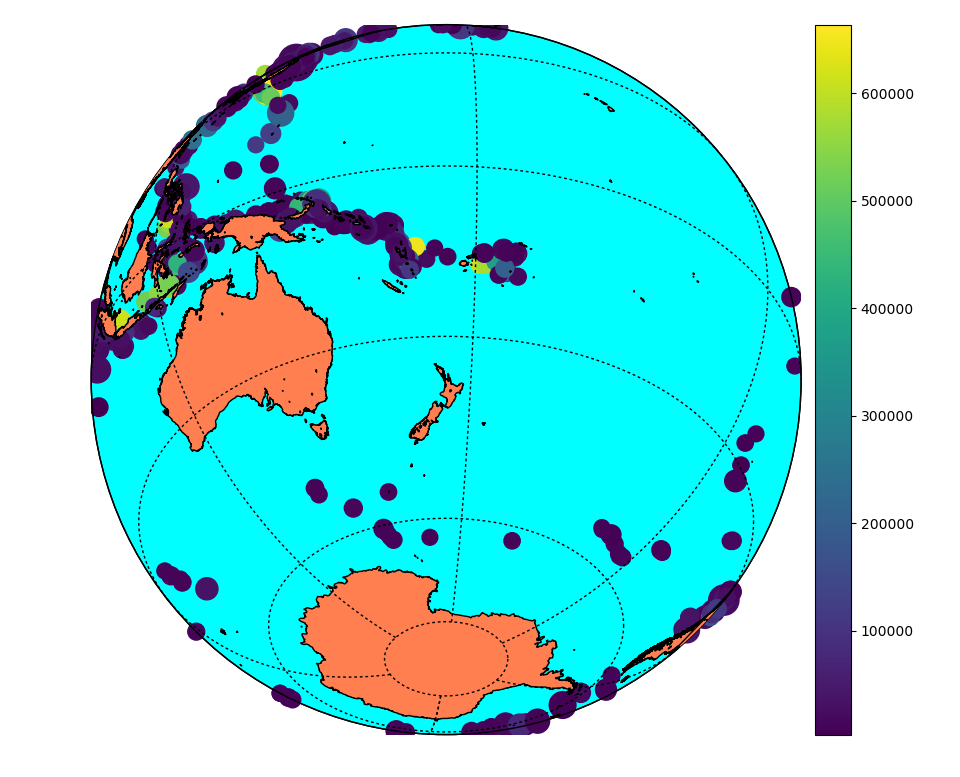
Following a resolution test of tomography of the AVF using global teleseismic sources, we perform a separate test considering the local events with Nick Rawlinson’s FMTOMO package.
The events considered have paths that involve direct and up-going waves (little p and s, as opposed to P and S in the teleseismic tomography).
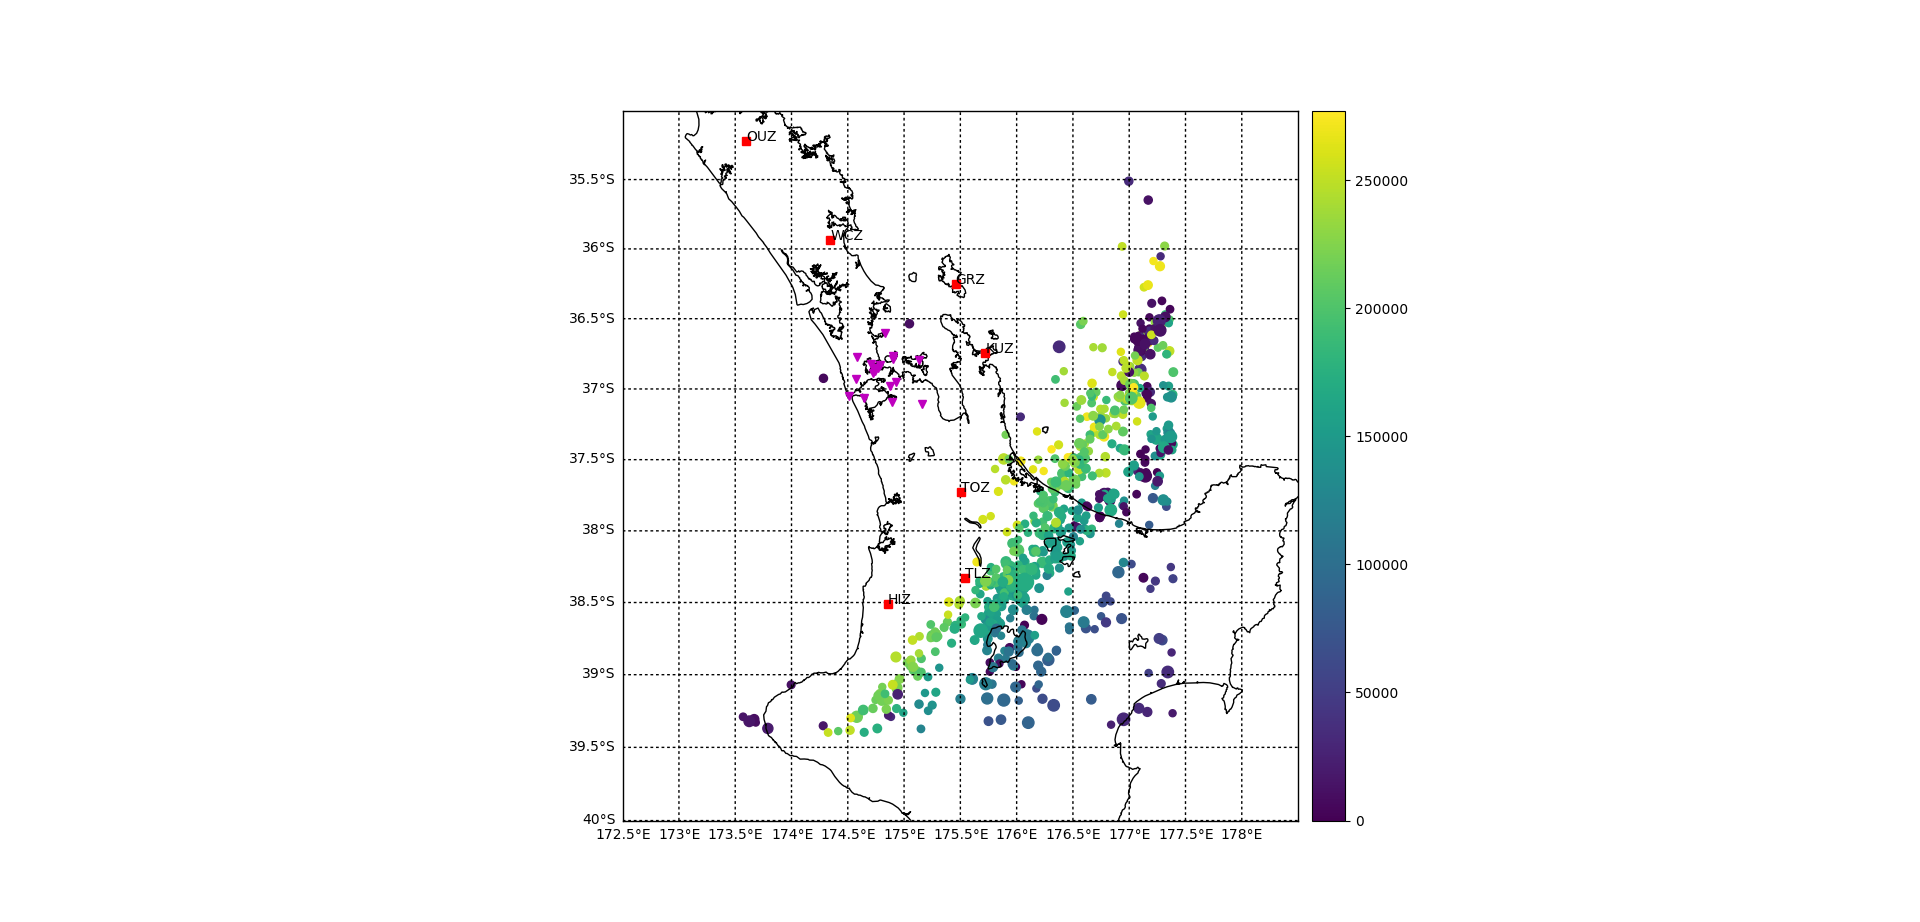
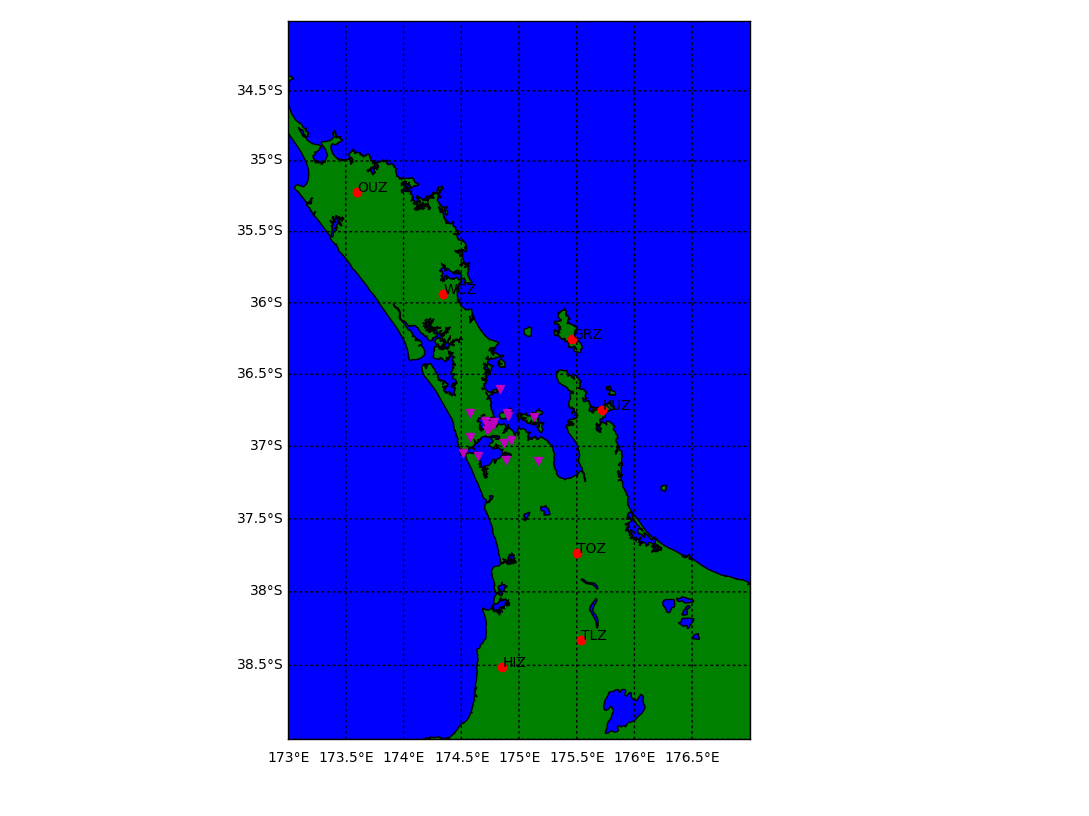
681 hypocentres and seismic stations in and around the AVF.
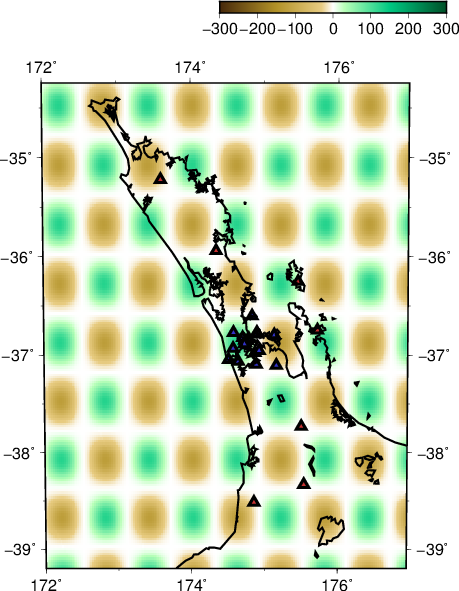
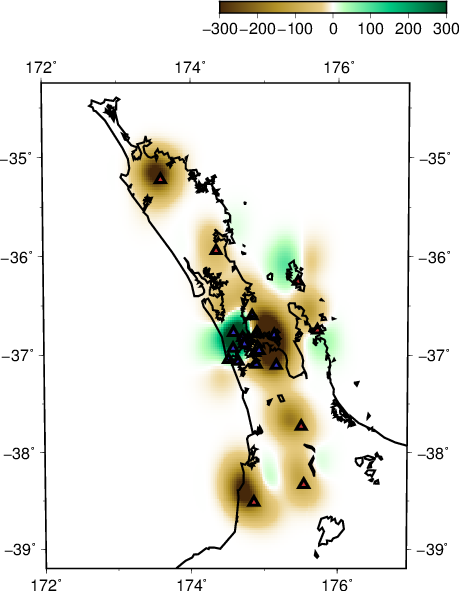
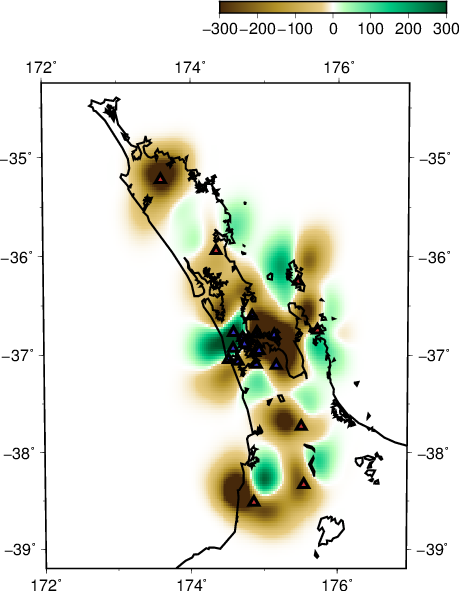
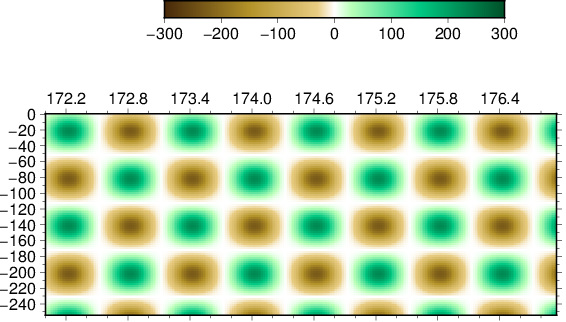
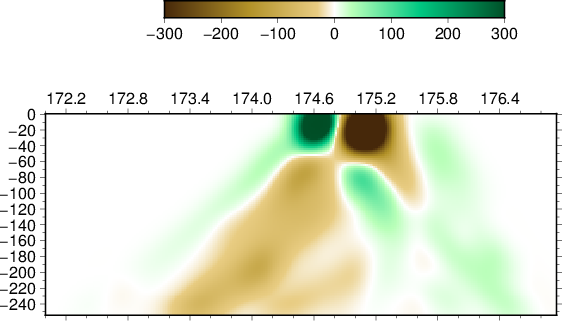
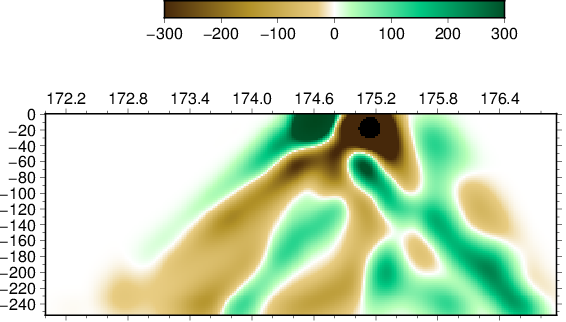
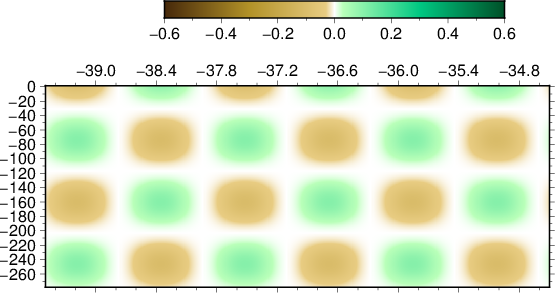
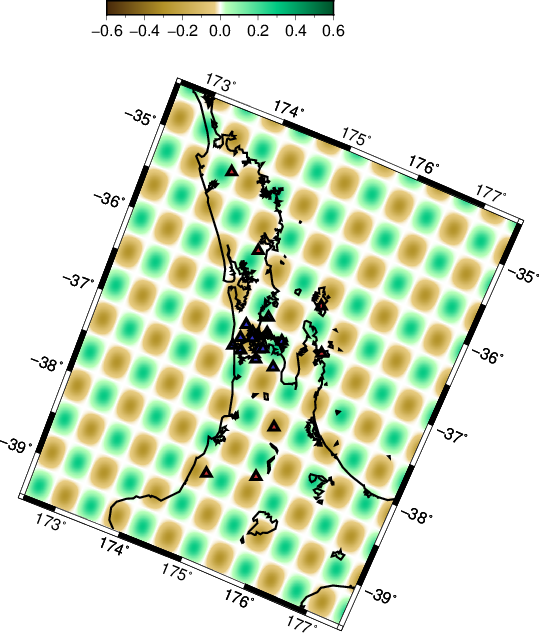
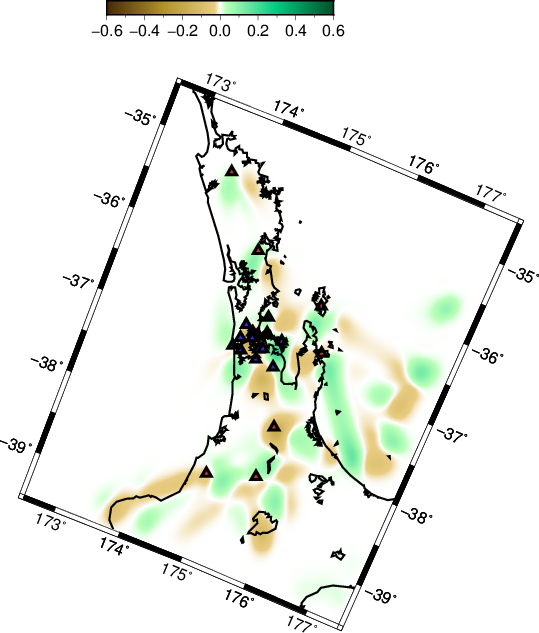
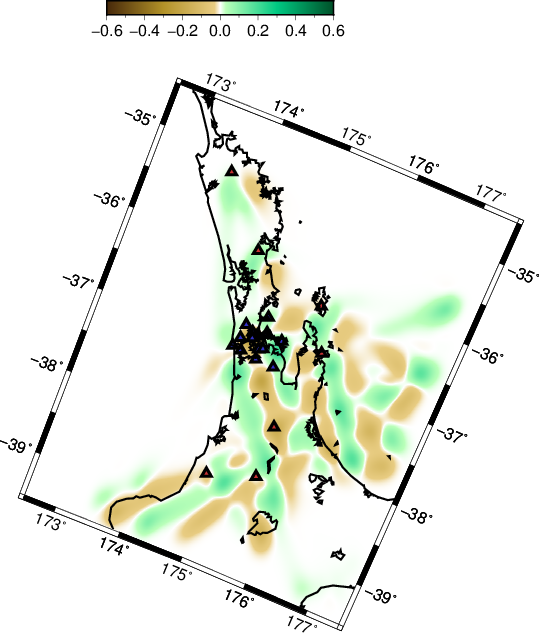
A depth slice at 90km resolves the checker-board pattern under the stations. Smearing is apparent in the latitudinal and longitudinal slices. There isn’t much difference in terms of the results between p- and s-wave inversion.
-
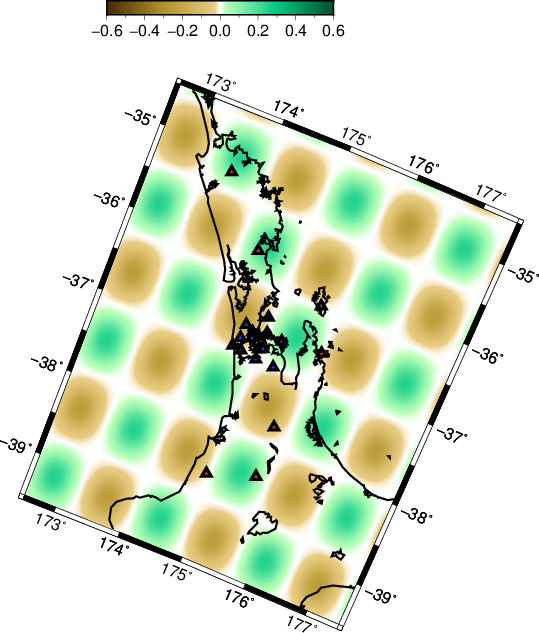
- Initial checker-board depth slice at 90 km
-
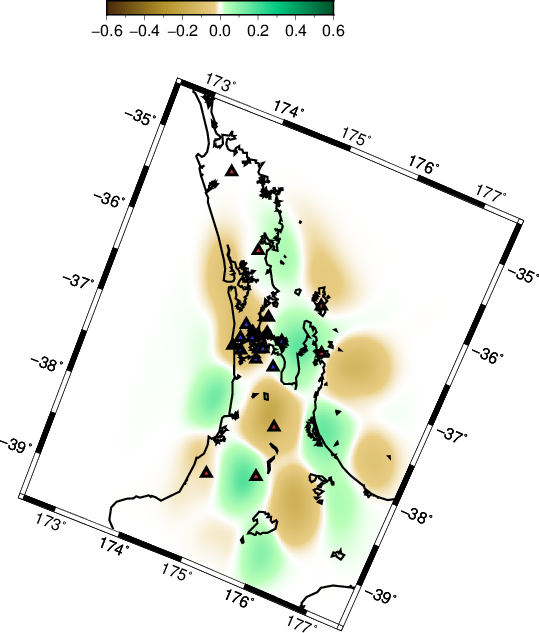
- Recovered checker-board P
-
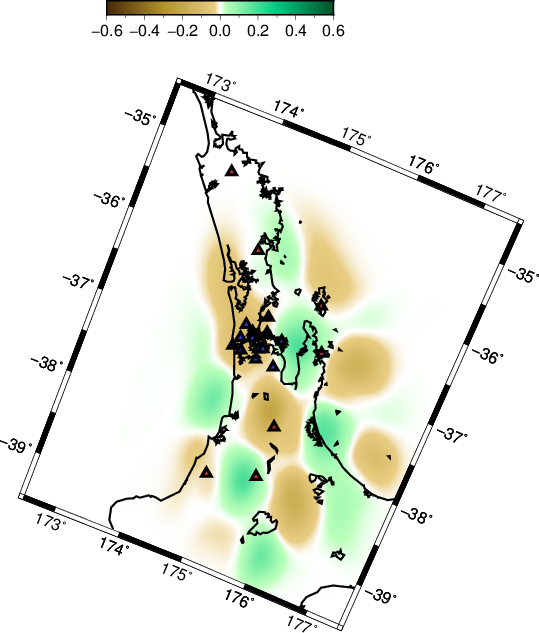
- Recovered checker-board S
-

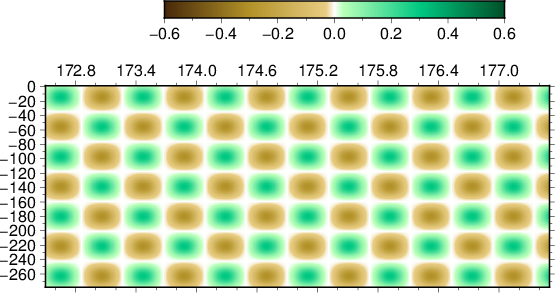
- Initial checker-board EW slice at 36.85 S
-
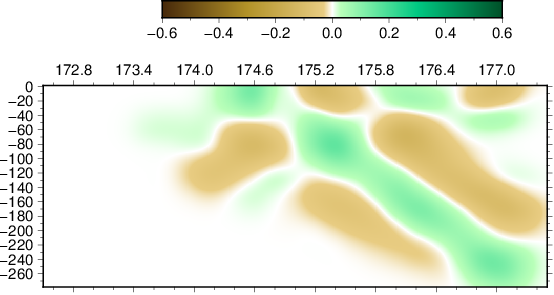
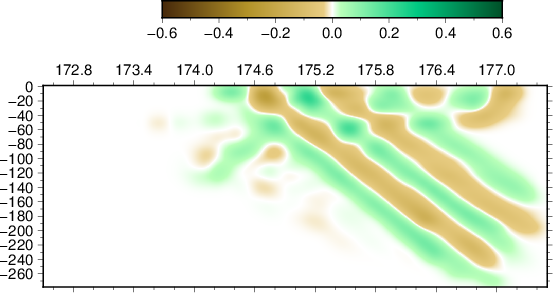
- Recovered checker-board P
-

- Recovered checker-board S
-
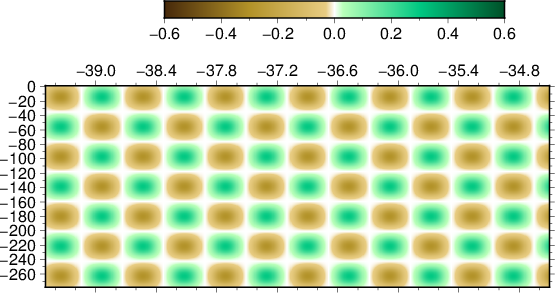
- Initial checker-board NS slice at 174.75 E
-

- Recovered checker-board P
-

- Recovered checker-board S
Using a finer checker-board
In order to resolve smaller scale structure in the subsurface, a finer scale checker-board was tested.
-
- Initial checker-board depth slice 20 km
-
- Recovered checker-board P
-
- Recovered checker-board S
-
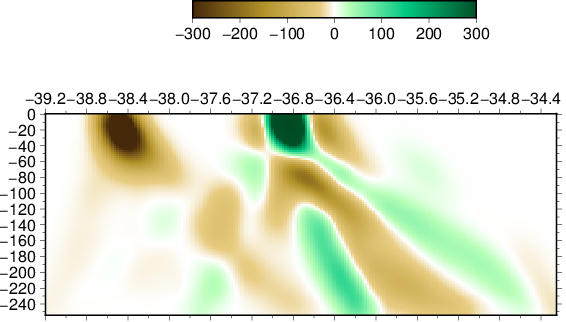
- Initial checker-board EW slice -36.95
-

- Recovered checker-board P
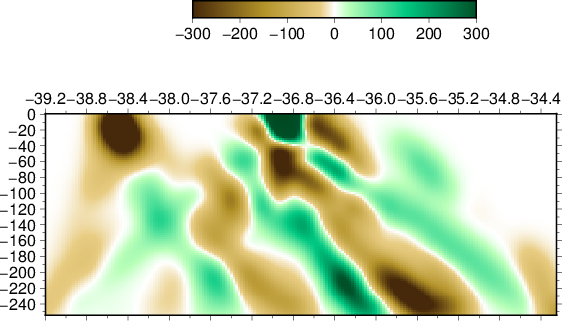
-
- Recovered checker-board S
-
- Initial checker-board NS slice 174.75
-

- Recovered checker-board P
-

- Recovered checker-board S
The first 60 km in depth seem resolved in this test. However, deeper inversion results mostly add up to the effect of smearing. Unlike the S-wave results for teleseismic tomography, s-waves seem to benefit our regional tomography results.
Summary
- Features on the order of ~50km, are possibly recoverable up to 150 km deep, 174.2 to 176.4 longitudinally, and -36 to -37.8 latitudinally.
- Features half this size may be retreived up to 60 km down, 174.2 to 177.2 longitudinally, and -36.6 to -37.4 latitudinally.
- S wave tomography shows a better lateral resolution for the periphery of the stations. Most prominently with the finer scale checker-board.