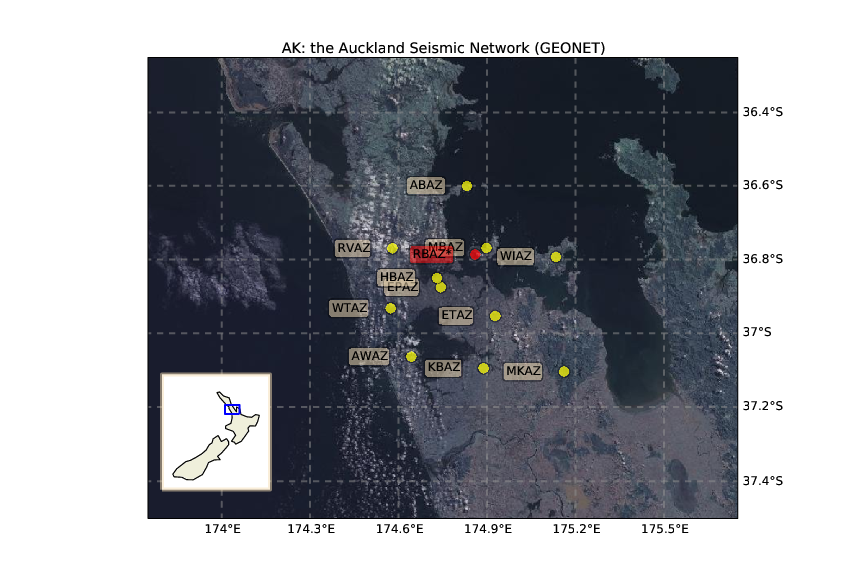
On February 21, 2014 DEVORA and the University of Auckland installed a multicomponent borehole seismometer on Rangitoto Island. Since this date, we have collected seismic data approximately every three weeks. RBAZ is a member of the Auckland Seismic Network (GEONET), mapped below.
The following are instructions on how to perform a seismic station service day:
- Before making the trip, be sure that you have all of the required materials:
- The key to open the station,
- An iPod with the appropriate app (not for your music, but to download the data!)
- Cable,
- Memory cards,
- Masking tape for labeling,
- A copy of the service day checklist.
- Contact the Department of Conservation (DOC) office on the island to arrange a ride to the site. If you are unable to arrange a ride, you may also be able to get a ride with the Fuller’s Ferry Volcanic Explorer Tour to the summit. The site is located about a 10 minute walk from the summit in a small clearing that is the former location of George Saunders’ batch.
- When you arrive at the site, follow the instructions on the service day checklist.
Upon returning to the University of Auckland, mount and save the data in /home/DEVORA/RBAZ/DATA/raw/servicedayN, where N is the Nth service day.
As of July 2014 there will be a computer located in Dr. Kasper Van Wijk’s office dedicated to this project. This is where the data should be stored. In addition to saving the data in this location, it may be a good idea to have a backup location or to create copies of the memory disks.
To convert the data from REFTEK to Mini-SEED use the following rt2ms.sh script:
#!/bin/sh

# bsh for loop

# script runs to convert gathered Reftek files created by arcfetch into separate

# integer PASSCAL Segy files. The original program rt_segy only works one file

# at a time, so script feeds in each file. Day directories are created at the

#level that script is run.. M. Alvarez 14.7.2010
# make dirlist as follows:

dirlist=`ls ./DATA/raw/serviceday3/` # note the ls command needs to be between back-quotes! (they don't show up here)
#for f in $( ls ../data/201216[2345] ); do

#for f in $( cat $dirlist); do

for f in $dirlist; do

rt2ms -f ./DATA/raw/serviceday3/$f -p AK_parfile.txt -o ./DATA/MSEED/$f

done
To view one day’s worth of data use the following readaday.py script
import glob

from obspy import read

from obspy.core.stream import Stream

from obspy import UTCDateTime

path = '/home/kasper/RBAZ/DATA/MSEED/'

date = UTCDateTime("2014-06-23T06:22:32.92")
day = str(date.year)+str(date.julday) # pick a Julian day, any Julian day (with data)

print day

files=glob.glob(path+day+'/*.1.m') # .1 is EHZ
#define an empty stream, then append each hour of the day to that stream:

st = Stream()

for file in files:

dummyvar = read(file)

st.append(read(file)[0])
# detrend and filter:

st.detrend('constant')

st.filter('lowpass',freq=2.5)
# plot:

st.plot(type='dayplot',title=st[0].stats.starttime, interval=60)
This should produce a day plot that looks something like this:

As you look through the data and find possible events, be sure to cross reference the event times with the nearby Motutapu station (MBAZ) for verification.
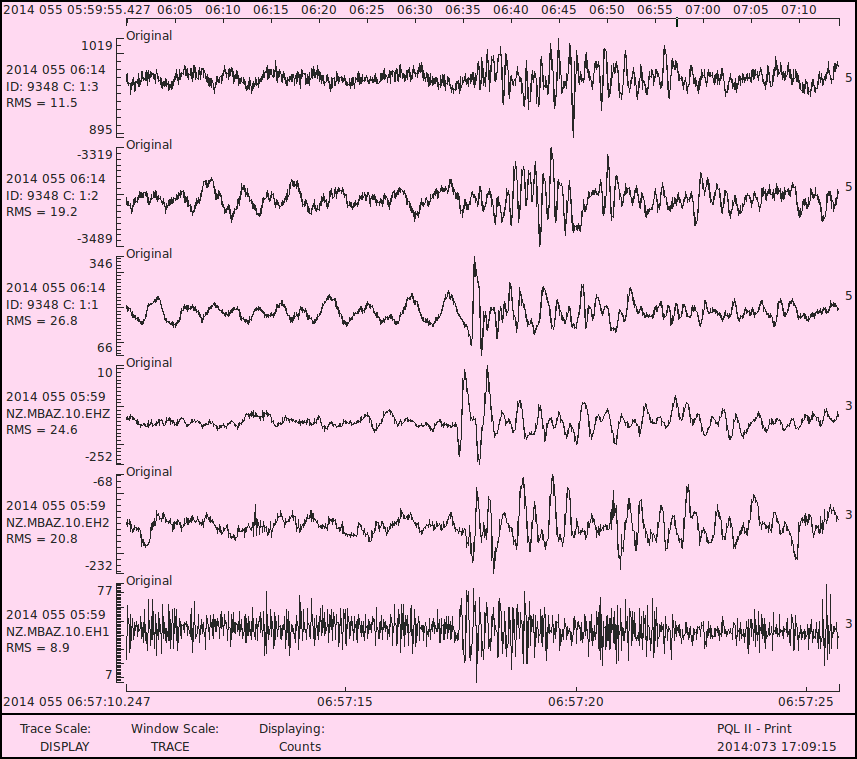 Here is a possible event from the third day of recording that shows up on both RBAZ and MBAZ. The top three seismograms are from Rangitoto (two horizontal and one vertical component, respectively) and the bottom three seismograms are from Motutapu (one vertical and two horizontal, respectively).