Category: PALNews (page 4 of 9)

News related to the PAL

AVF P-wave travel time tomography: 100+ teleseismic events

We implement P-wave travel time tomography using FMTOMO, to image the subsurface structure beneath the Auckland Volcanic Field. The input information, which is the residual travel time is obtained using an adaptive stacking code, tcas by Nick Rawlinson. Inversion is then implemented using more than one hundred teleseismic sources.

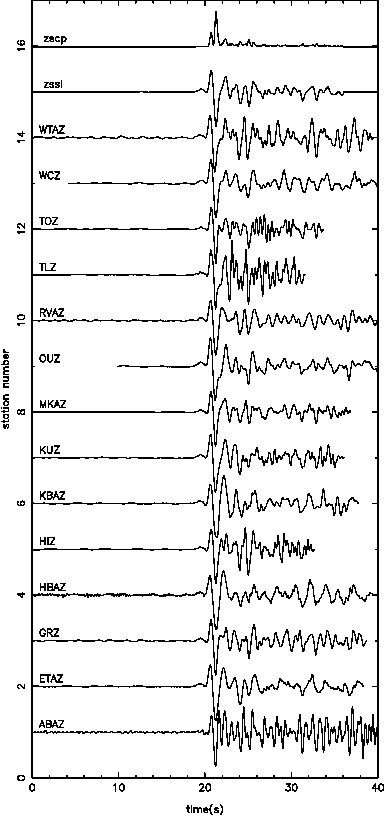
getting the residual time: tcas

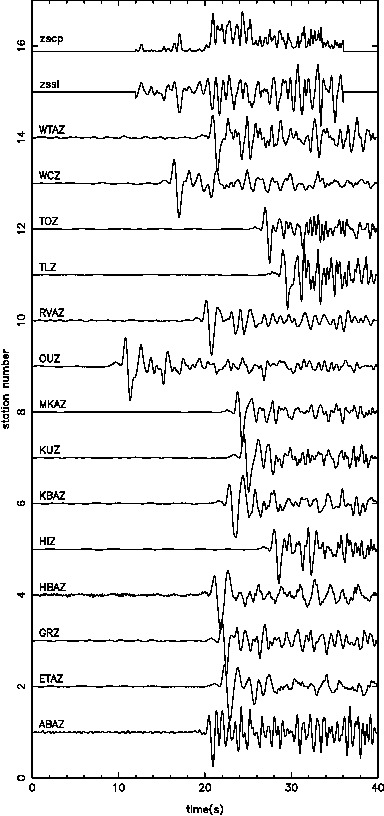
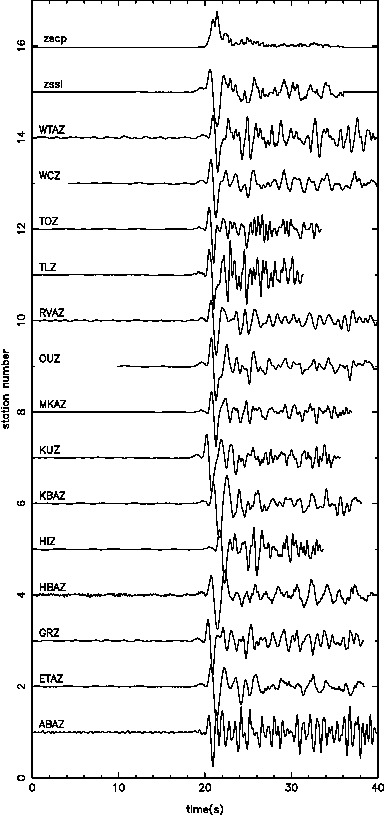
The code tcas works by taking the predicted time (eg. using ak135 1-D Earth model) to a reference station to be compared with other stations. The difference between the predicted time is the base for the approximate initial alignment. Cross correlation is then performed to create the final improved alignment from which we get the residual time from the 1D-Earth model that we used.


teleseismic inversion

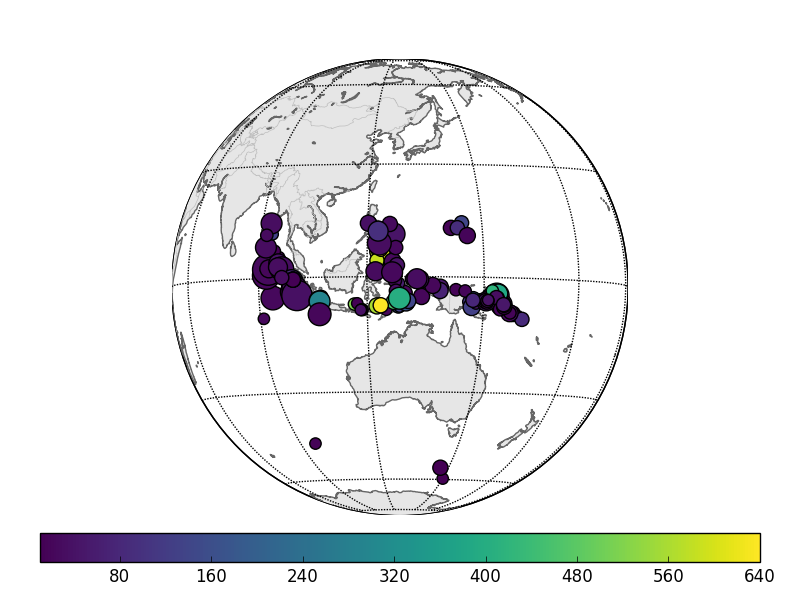
We apply to the tcas code 131 earthquakes limited to epicentral distance greater than 27 degrees to avoid triplication of the P-wave arrival.


100+ events


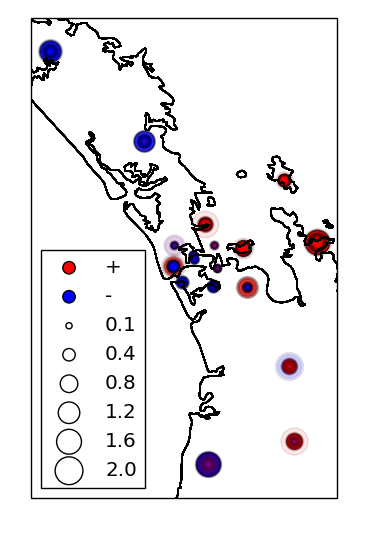
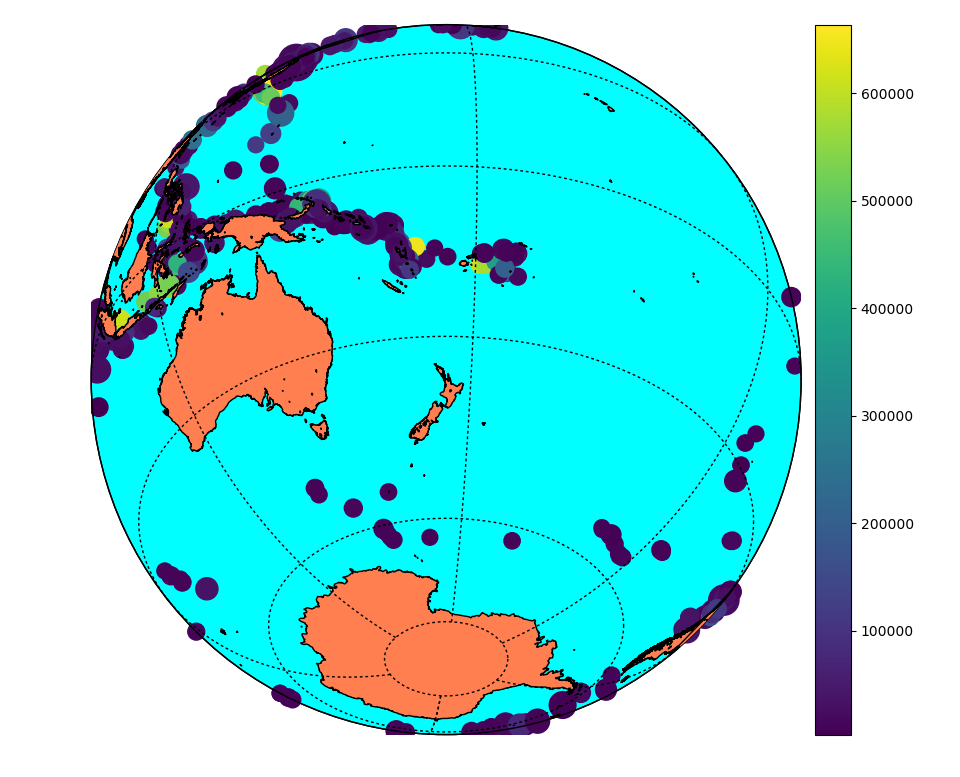
The output residuals at every stations are plotted on a map to gauge the underlying trend in velocity field. Red color on the map shows positive residual which means larger than average value thus a slow field and vice versa for blue. The size of the circle shows how big is the residual. The indication is that there is a prevalent slow region to the east of the AVF.


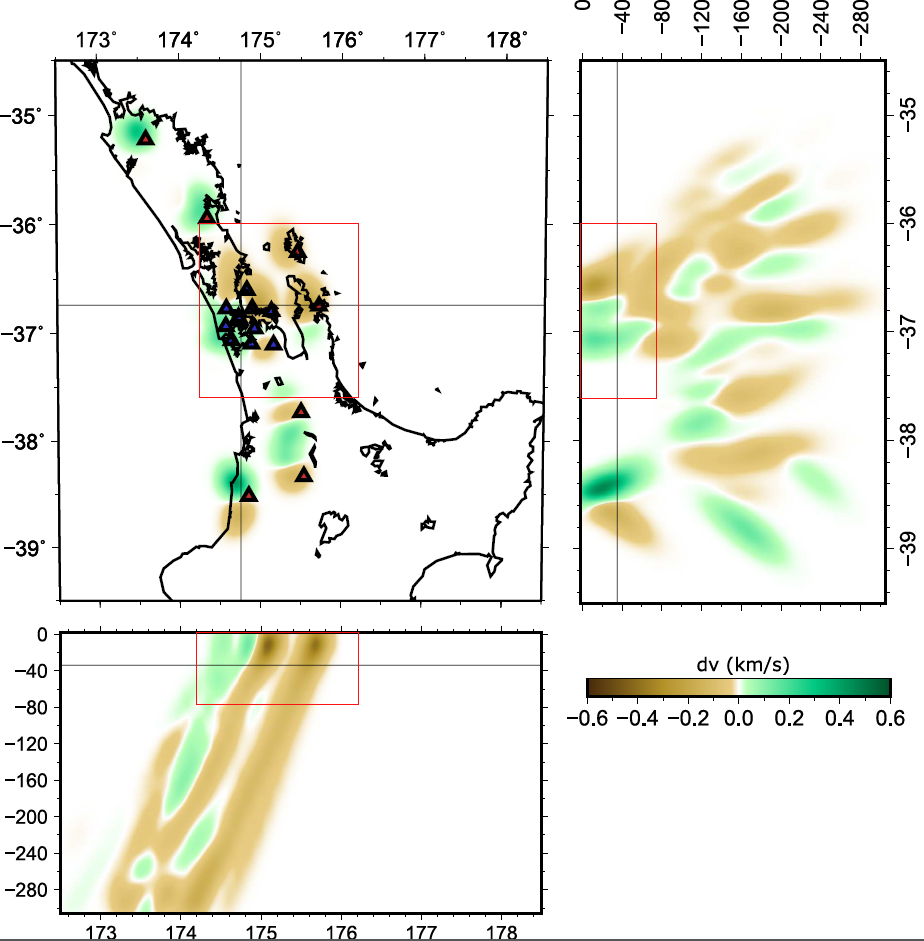
Inversion improve the preliminary trend by showing with more precision the split from positive to negative anomaly. The split is striking Northwest-Southeast extending to 80 km deep. We interpret this to be related to the Junction Magnetic anomaly of the Dun Mountain Ophiolite Belt.
 

Teleseismic inversion


Zoe is off to Bristol to join the PhD programme

Zoe, one of the original Apple Seismologists, is off to the University of Bristol, UK! She’s going to be working with Dr Judy Rorison in the Photonics team. She works primarily in development of fundamental materials for use in Optoelectronics focusing on the use of Quantum Photonics/ Quantum Dots and Wells, and development of Optoelectronic devices. After obtaining her Btech degree in the PAL, Zoe worked for Vodafone, but is now ready to accept a new challenge in the UK. All the best, Zoe, and please stay in touch!

Combined ultrasonic and photoacoustic imaging of the carotid artery

Today, Dr. Jami Johnson’s final PhD thesis chapter found its way into the peer-reviewed literature. Her work on combined laser ultrasound and photoacoustic imaging of an ex-vivo carotid artery has appeared in the March issue of Photoacoustics. The PALs involved (Jami and Kasper) would like to thank our external collaborators: Merv Merrilees and Jeff Shragge for this exciting and ultimately very successful experience!

Jupyter notebooks for mathematical methods in the physical sciences

A Guided Tour of Mathematical Methods for the Physical Sciences is based on a philosophy that learning mathematics for the physical sciences, requires pen and paper. Learning by doing. Three editions in, this philosophy still holds strong, but heaps of things have happened since the first edition in 2001. Numerical methods play an ever-larger role in the physical sciences, for example. The Python programming language has really exploded on the scene, and more recently the jupyter notebook has been developed to facilitate learning numerical methods in python. To accompany the latest edition of our book – and your pen and paper – we are writing one jupyter notebook per chapter.

If you are new to jupyter notebooks and/or python, the online resources are virtually endless, and the installation — on any operating system — is easy with conda. You can download, and even run, the notebooks here.

PORO/PAL party during the GSNZ meeting

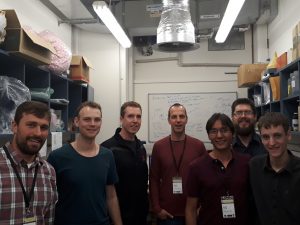
From left to right: Steve Brennan, Sam Hitchman, Paul Freeman, Kasper van Wijk, Evert Duran, Josiah Ensing and Jonathan Simpson.

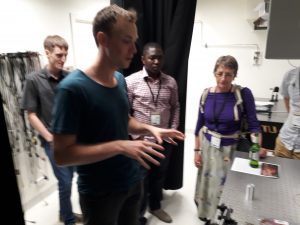
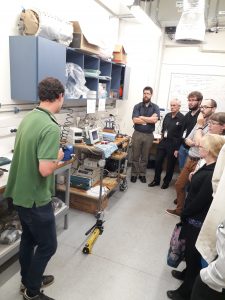
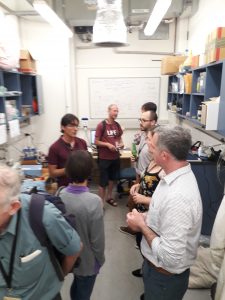
This week the annual GSNZ meeting  was on University of Auckland campus. To celebrate a successful year in research, we hosted a small get together in our labs for tours, demos, drinks and some food. Below are a few photos as proof, despite the “zapruder film” quality of these…

Sam showing Professor Martha Savage and other guests his new optical rock strain (and temperature) meter

James Clarke giving an overview of the research projects and equipment in the PORO lab to a captivated audience.

Evert Duran with guests, including Professors John Townend and David Prior.

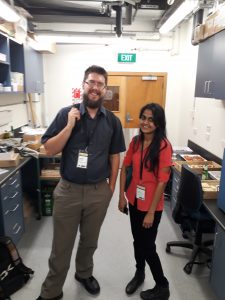
Shreya Jagdish Kanakiya and Josiah Ensing


Jami got engaged!

Jami Johnson sent us word of her engagement to her Kiwi  boyfriend Sam! Here is a picture of the happy couple on a recent trip to Norway. We wish Sam and Jami all the best (and for them to move back to New Zealand, of course).

Apple Seismology

Today, our paper on Apple Seismology appeared in Physics Today. It was a follow up on Sam and Zoe’s experiments, highlighting the similarities between seismic waves and normal modes in the Earth, and their acoustic equivalents in a Braeburn apple.

In the panel on the left, seismic (surface) waves traverse Earth, while in the right panel laser-generated and detected surface waves circle the apple.

Resolution test on the AVF

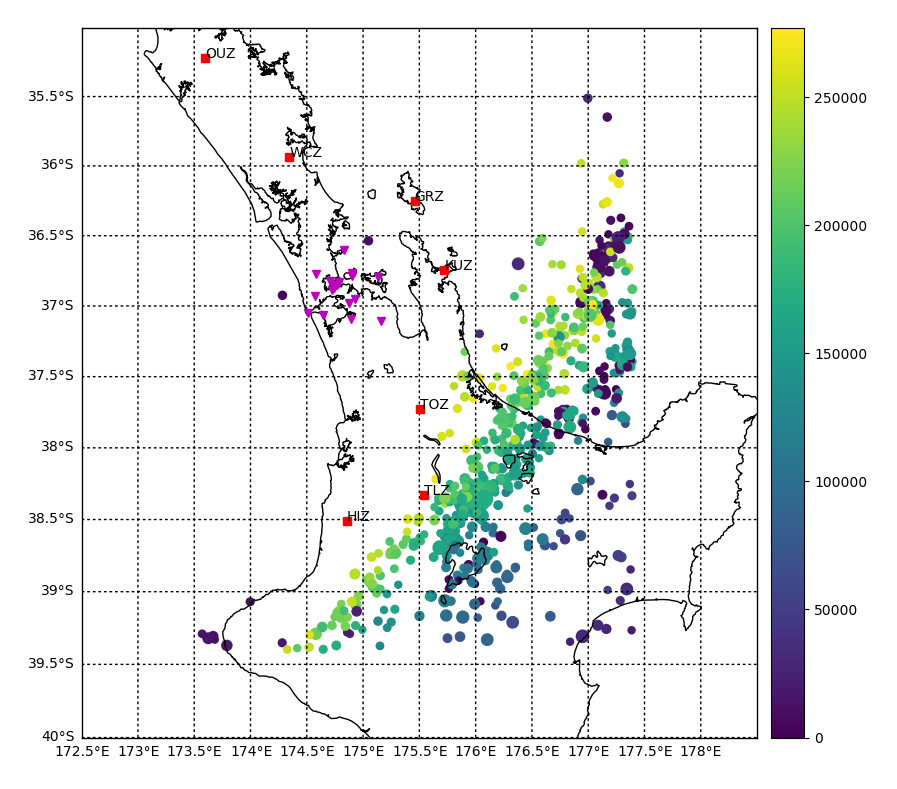
We propose to perform P-wave tomography to infer the structure beneath the AVF, with Nick Rawlinson’s FMTOMO. Our first step is to establish the resolution that we can expect from this exercise. Below, we plot the locations of the earthquakes — a total of 1330 cataloged events, 681 local + 649 teleseismic — used in this test:


The local events made up the sources coming in from the southeast of the receivers array. Whereas teleseismic sources complement this with incoming rays from other directions but most notably from the Northwest.

We compute synthetic seismic P-wave arrival times for the AVF seismic stations, as if the earth structure under the AVF has a checker-board pattern. For this test, this will be our “true” model of the Earth. And so the objective of this test is to invert these synthetic travel times to recover the “true” model checker-board pattern. Regions where the inverted results show a checker-board pattern suggest a good resolution. And the size of each checker-board pattern imply the size of the smallest feature resolvable.

Coarse Checker-board Test

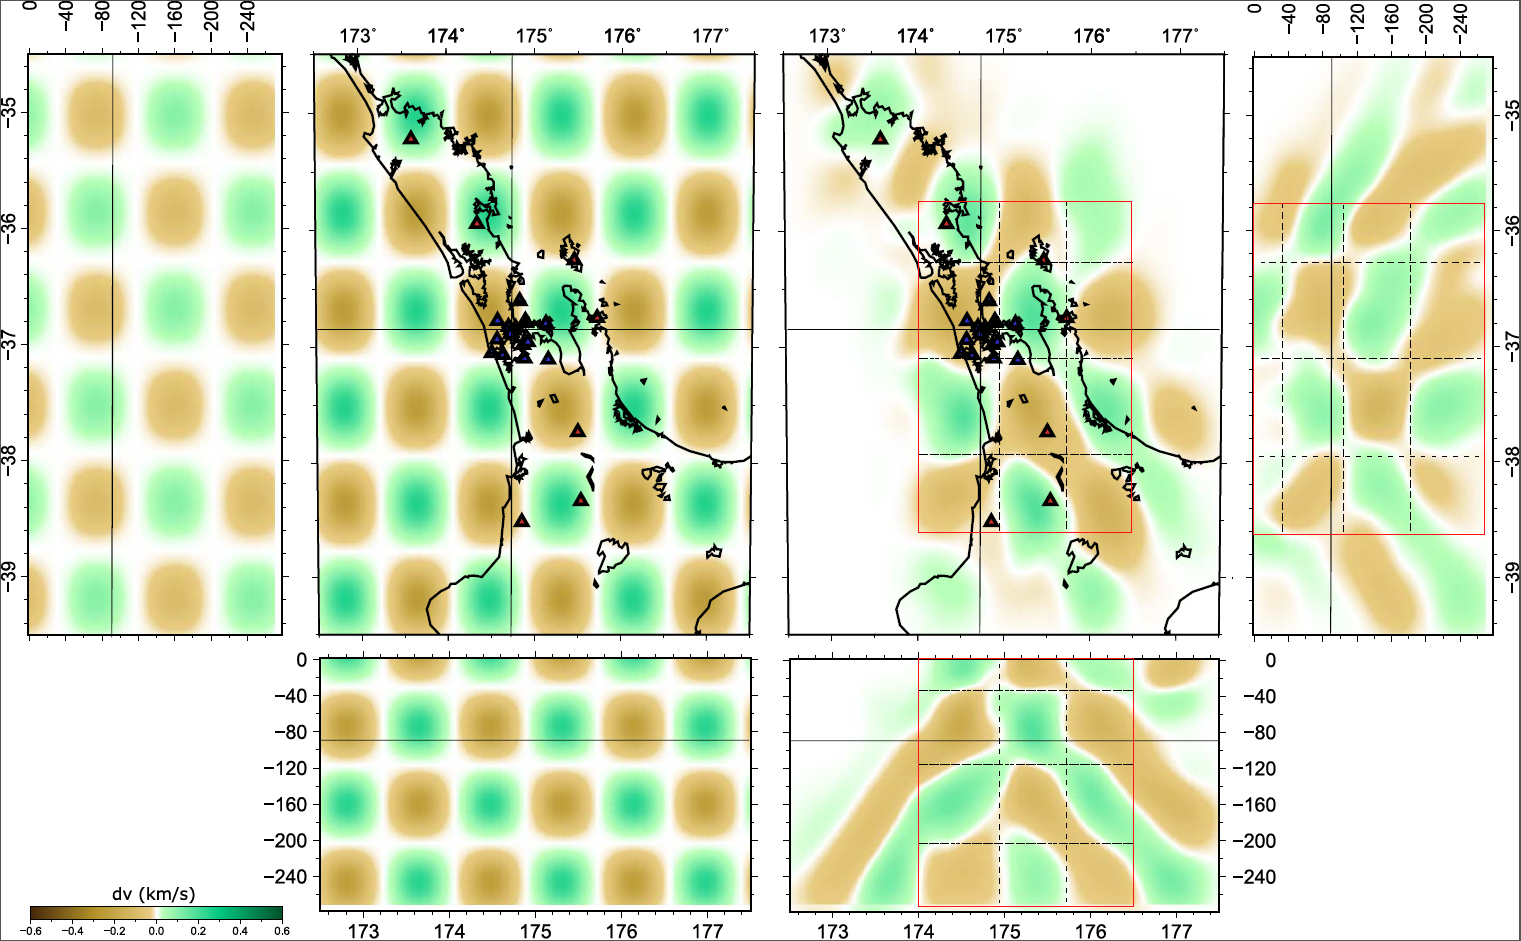
The first checker-board model shall have a wide grid spacing creating a fairly large checker-board patterns. In the following image, the ensuing checker-board model is represented by the three panels on the left while its recovery after the inversion is represented by the panels on the right.


Large checker-board test


  • Dimension of the region where resolution is most exemplary is signified by the red box, ranging from Northland to Waikato, and to 280 km depth.
  • Outside of the box, the smearing artefact is too prominent. Caused by ray paths having similar orientation.
  • Within the box, the size of the features that are resolvable, corresponds to the size of each checker-board, is in the order of 60 km.

Fine Checker-board Test

We reduce the grid spacing, creating a smaller sized checker-board model, inferring that smaller features now have the potential to be resolved.


  • The red box where resolution is commendable, is now span over the Auckland region, down to about 80 km deep.
  • Within this box, subsurface features on the scale of 30 km can be resolved.

Congratulations, Dr. Jami Johnson!

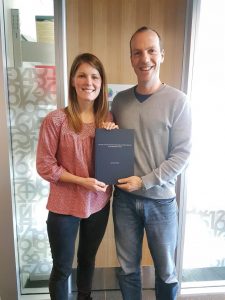
It’s the end of an era… Jami Johnson successfully completed her PhD thesis in photoacoustic imaging.  She is now off to The University Pierre and Marie Curie, in Paris (France) to pursue postdoctoral research in medical imaging. We wish Jami all the best, and we will follow her in what will undoubtedly be a very exciting career. The PALs want to thank Jami for all her efforts and the wonderful memories she leaves behind.


Our first glimpses into the Auckland Volcanic Field

Today, the New Zealand Journal of Geology and Geophysics published Josiah‘s first results using ambient seismic noise to peek deep into the lithosphere under the Auckland Volcanic Field (AVF). This noise, created by the oceans surrounding the AVF, suggests the lithosphere under Auckland is made up of oceanic and continental components. Further studies aimed at increasing the resolution of our results may help explain why this active volcanic field is where it is.